

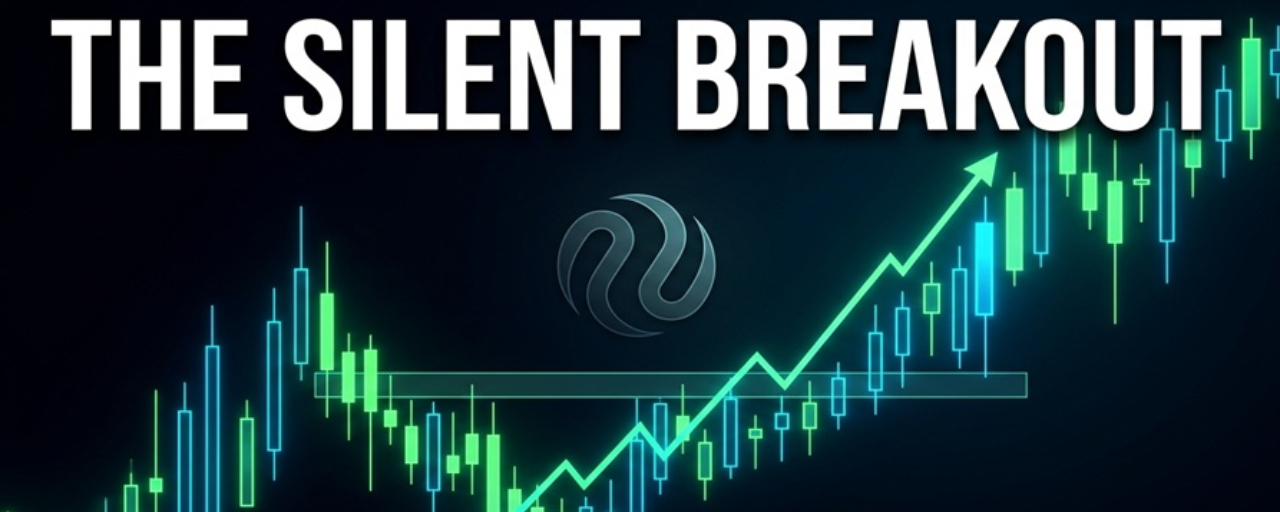

Most traders are staring at the same major charts waiting for a breakout that keeps getting delayed. Meanwhile, a different market structure is forming right under the radar.
Injective has spent the last several months building a massive base. While the broader market chops around, spot volume on this asset has quietly been climbing during minor dips. The price action is compressing. Volatility is dropping to levels not seen in months. This kind of compression rarely lasts forever.
Look at the daily chart. The price is trapped in a tightening symmetrical triangle. The 50-day moving average has flattened out and is now converging with the 200-day moving average. This squeeze is building energy. The RSI on the daily timeframe is hovering right around 50. This neutral reading is actually a good sign here. It shows the asset is not overbought and has plenty of room to run if momentum shifts. However, the bulls need to see a high-volume candle close above the upper trendline to confirm the breakout. Without volume, it is just another fake-out waiting to happen.
Charts only tell half the story. The fundamental driver here is the continuous burn mechanism. Every week, a portion of the supply is permanently removed from circulation. This creates a persistent deflationary pressure. When you combine a shrinking supply with a technical breakout, the upside potential becomes highly asymmetric. The ecosystem is also seeing increased deployment of decentralized derivatives, which directly drives fee generation and subsequent burns.
The buyers need to push the price above the immediate resistance zone with conviction. We need to see futures open interest rise alongside the spot price. If open interest stays flat while price rises, the move lacks leverage and will likely fail.
If the price loses the lower boundary of the current consolidation zone, the entire bullish thesis is dead. A breakdown on high volume means the accumulation was actually distribution. In that scenario, the next major support lies much lower. Never ignore the risk of a broader market pullback dragging everything down with it.
Patience is a trader's best edge. Waiting for the market to show its hand is always better than guessing the direction of a coil. Watch the volume. Watch the breakout. Let the chart prove the trend.

Are you watching the daily volume or the weekly burn data more closely right now? Let me know below.
Disclaimer: This analysis is for educational purposes only and is not financial advice. Crypto markets are highly volatile. Always do your own research, manage your risk carefully, and never trade with funds you cannot afford to lose.