


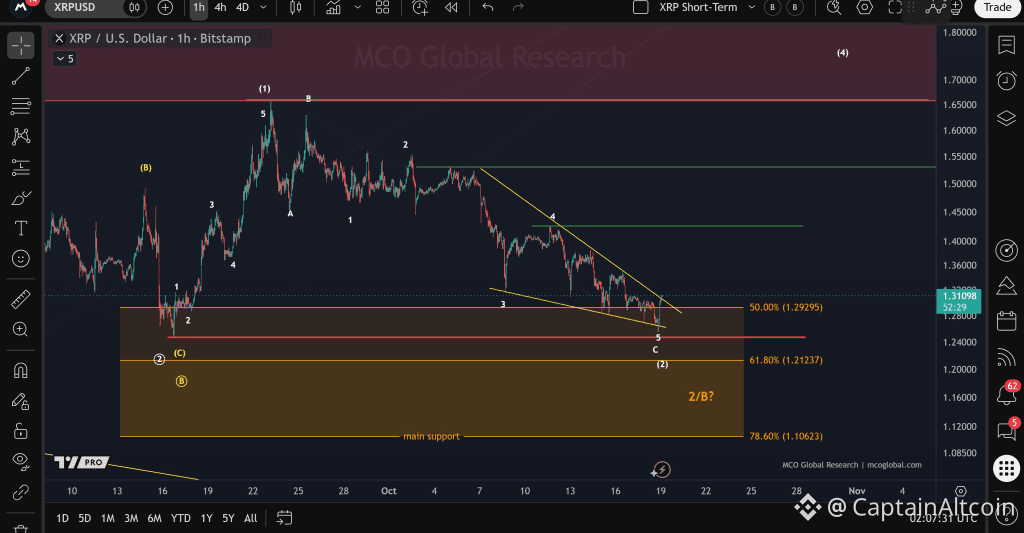
XRP price is testing one of the more important short-term levels on its chart, and More Crypto Online believes the token is trying to break above a descending trendline that has controlled price action for much of October.
The setup is interesting because it does not depend on an extreme target. Instead, the XRP chart lays out a realistic recovery path through several clear resistance levels, with equally clear downside invalidation.
XRP was trading around $1.31 on the one-hour Bitstamp chart when the analysis was shared.
XRP Is Testing the Trendline That Has Controlled the Decline
The yellow descending trendline on More Crypto Online’s chart connects a series of lower highs formed after XRP traded above $1.50 earlier in October.
The XRP price has now pushed directly into that line and is attempting to move above it.
I would not interpret this as a confirmed reversal yet.
A brief move above a trendline can fail quickly. What matters more is whether XRP can hold above it and start building higher lows.
The chart also shows a five-wave decline, with the recent move into roughly $1.24-$1.25 labelled as Wave 5 and also Wave C of the broader correction.
That makes the current area important.
 Source: X/@Morecryptoonl
If that count is correct, the latest low may have completed the bearish sequence and opened the door for a larger recovery.
The First XRP Targets Are Relatively Realistic
The 50% Fibonacci level on the chart is marked at $1.29295.
XRP was already trading above that level in the screenshot, near $1.31, which improves the short-term structure.
If price can hold $1.29-$1.30 and establish itself above the yellow trendline, the first meaningful upside area is around $1.42-$1.43.
That would represent roughly 9% upside from $1.31.
The next resistance is close to $1.53. A move there would equal approximately 17% upside.
Above that, the larger resistance zone is around $1.65, which would put XRP roughly 26% above the chart price.
That gives the setup a clear progression:
$1.29 hold → trendline confirmation → $1.42-$1.43 → $1.53 → $1.65.
This is why I find the analysis more realistic than the usual XRP calls that immediately jump to multi-dollar targets.
Read also: Ripple Made 5 Big Moves in 10 Days, and the XRP Community Is Connecting the Dots
What Would Invalidate the Bullish XRP Setup?
There is still substantial downside risk.
If the trendline attempt fails and XRP falls below the recent $1.24-$1.25 low, the bullish interpretation becomes much harder to defend.
The chart marks the 61.8% Fibonacci retracement around $1.21237.
Below that, More Crypto Online identifies the 78.6% retracement near $1.10623 as the main support area.
So I would view $1.24 as the first serious warning level.
A loss of that area could expose $1.21, and a deeper breakdown would put approximately $1.10-$1.11 back into play.
XRP move Interpretation Next area Hold $1.29-$1.30 and clear trendline Initial bullish confirmation $1.42-$1.43 Break $1.43 Recovery strengthens ~$1.53 Break $1.53 Larger reversal becomes more credible ~$1.65 Fall below $1.29 Break attempt weakens $1.24-$1.25 Lose $1.24 Recent low becomes vulnerable ~$1.21 Lose $1.21 Deeper correction remains active $1.10-$1.11
For me, the most important level is not $1.65 yet.
It is $1.42-$1.43.
If XRP can first break the yellow trendline and then reclaim that resistance, I would take the recovery much more seriously. Until then, this remains an encouraging attempt to reverse the short-term decline, not a confirmed trend change.
For more crypto news and price predictions, click here.
Subscribe to our YouTube channel for daily crypto updates, market insights, and expert analysis.
The post This XRP Price Prediction Might Be One of the Most Realistic Right Now appeared first on CaptainAltcoin.