



⏰ WAKE UP CALL — TIA JUST PRINTED ITS 2026 HIGH
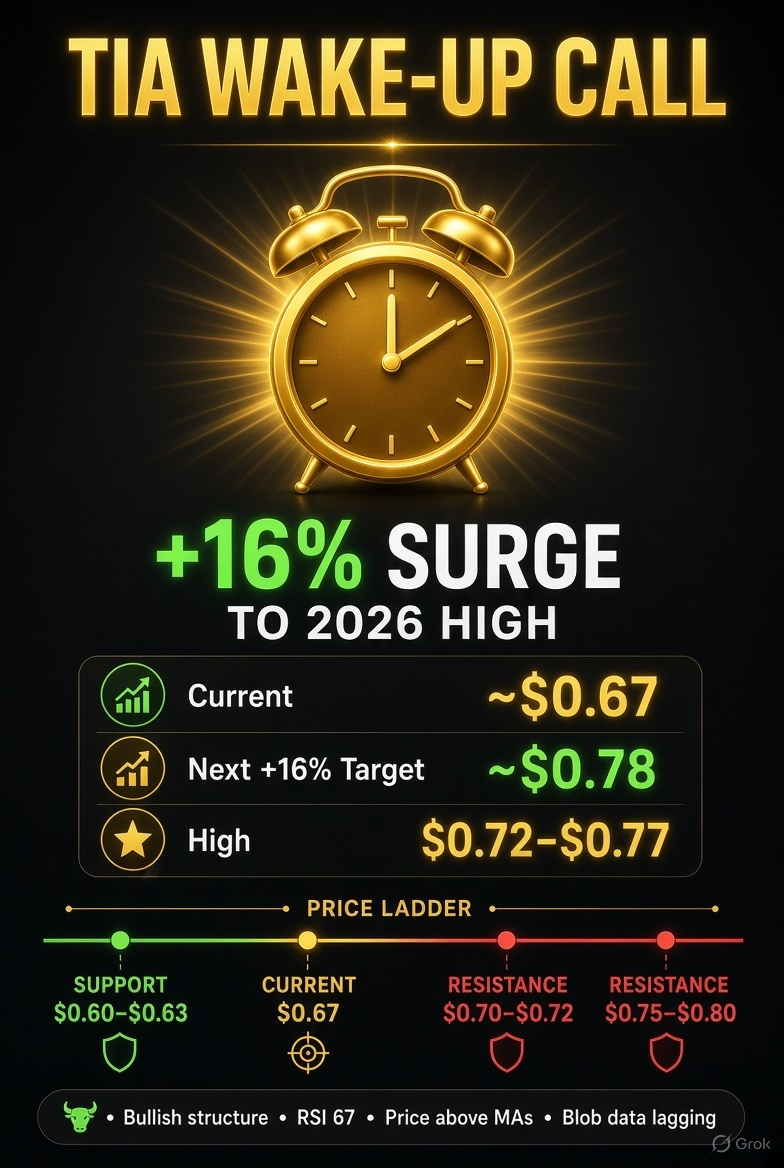
Celestia just ripped +16-17% in a single session and tagged the highest price of the entire year.
High of the move: $0.7233–$0.769
Current zone after the inevitable pullback: $0.66–$0.67
This is not random noise.
The Numbers That Matter Right Now
24h high: $0.769
Weekly gain: ~38–40%
Monthly gain: ~90–118%
From August low (~$0.29): roughly +130–140%
Market cap during the surge: mid-to-high $600M range
Next pure +16% leg from current levels lands at ≈ $0.78.
That zone sits right in the middle of the next resistance cluster that every serious chart is watching ($0.75–$0.80).
Technical Reality Check
Price is still trading above every major moving average (20, 50, 200).
50-day remains above the 200-day — structure is intact.
Daily RSI cooled to the 66–70 zone after touching overbought. Healthy, not exhausted.
MACD still positive and above signal.
ADX shows a strong trend is in force.
Immediate battlefield:
Resistance — $0.70 / $0.715–$0.72 then $0.75–$0.80
Support — $0.66 pivot, then the critical $0.60–$0.63 breakout zone
Lose $0.60–$0.63 cleanly and the recent breakout narrative weakens. Hold it and the path toward $0.78–$0.80 stays open.
Network Metrics vs Price — The Divergence
While TIA was climbing hard, daily blob data posted actually declined:
2.77 billion bytes → 2.05 billion bytes (Sept 18 to mid-Oct).
Fees remain tiny (still under $200/day in most recent readings).
Staking ratio sits around 43% with ~5.4% APR and inflation compressed near 2.3%.
Price is running ahead of current usage. That is the classic early-stage tension. The market is pricing the future capacity unlock (Fibre / v10) more than today’s blob volume.
Sentiment & Market Effect
Broader altcoin risk-on rotation + fading near-term rate hike fears provided the fuel. TIA became one of the cleanest high-beta expressions of that rotation.
Traders who ignored the multi-week base paid the price. Those who respected the structure are now sitting on substantial unrealized gains.
The divergence between rising price and softer near-term data demand is the real conversation. Either usage catches up as Fibre lands, or the market eventually re-prices the gap. Both outcomes create volatility.
The Analyst View
This is a textbook momentum expansion off a multi-month base.
Structure is bullish. Momentum is still constructive after the pullback. Network fundamentals are in a temporary lag relative to price.
The next 16% is mathematically clean from here. Whether the market delivers it depends on two things only:
1. Does $0.60–$0.63 hold on any deeper retest
2. Does the Fibre narrative continue to attract capital before actual data demand expands
Everything else is noise.
Stay sharp.DOYR




#NasdaqDowWeeklyGapWidestSinceJuly2002 #Nasdaq100Falls5.5%InWorstWeekIn18Months #StrategySharesFall9%OnFriday #USPPIRises6.3%YearOverYear