

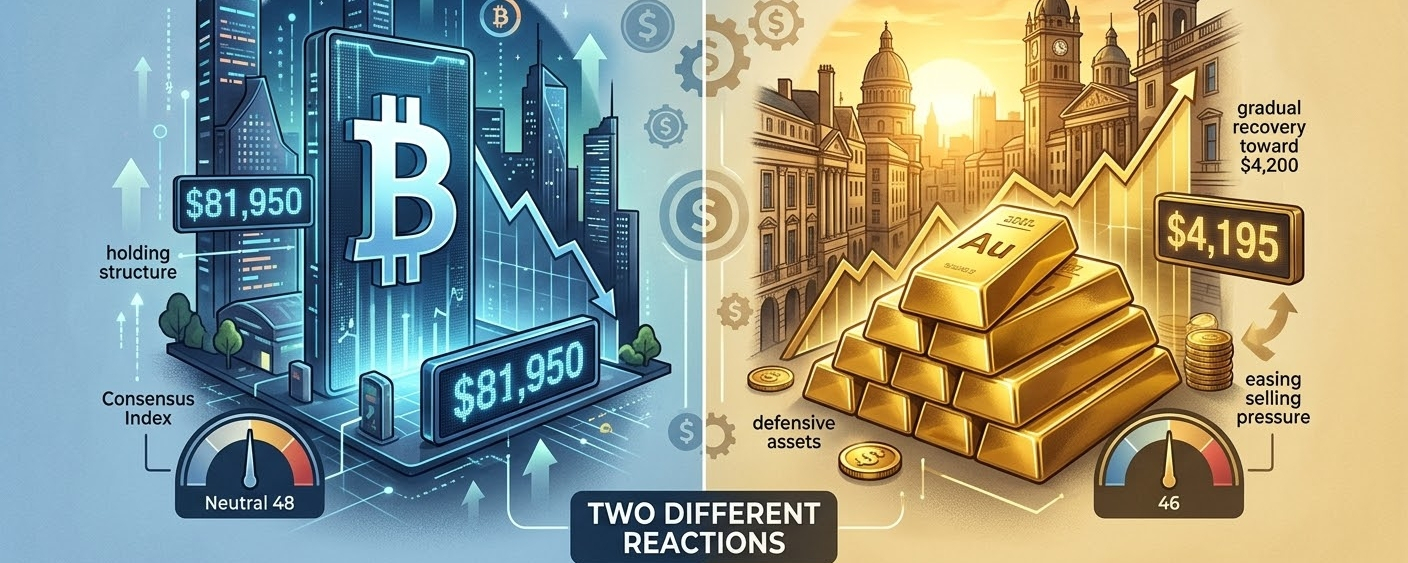


I’ve been watching the recent relationship between Bitcoin and gold because the contrast is becoming more interesting than either chart on its own. Bitcoin has slipped below $82,000, while gold is gradually recovering toward $4,200. Both are responding to the same macro environment, but the market is assigning them very different roles right now.
For me, the important question isn’t which asset moves first. It’s whether the underlying structure can support a sustained recovery once interest-rate expectations become clearer.
Rate Expectations Are Still Driving the Conversation
US inflation remains a major variable. September CPI came in at 3.7%, above both the 3.6% expectation and August’s 3.4% reading. That keeps inflation meaningfully above the Federal Reserve’s 2% target.
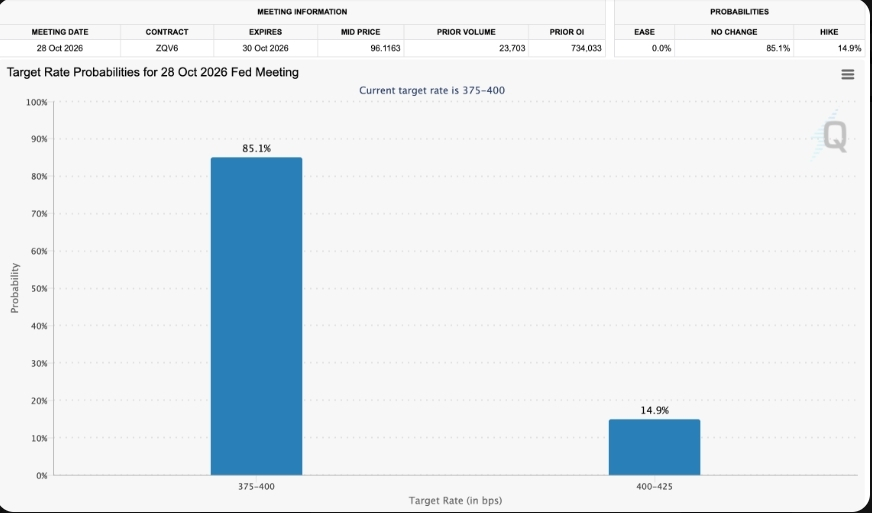
At the same time, markets are increasingly pricing in a pause, with the FedWatch data cited in the analysis showing an 85% probability of rates remaining around 3.75%–4.00%.
That creates an awkward middle ground.
Inflation is still sticky enough to keep policy restrictive, but expectations of additional rate hikes are easing. For risk assets, that distinction matters. Bitcoin needs improving liquidity expectations, while gold can benefit from demand for defensive assets even when monetary policy remains relatively tight.
Bitcoin Is Holding Structure, But the Recovery Has Work to Do
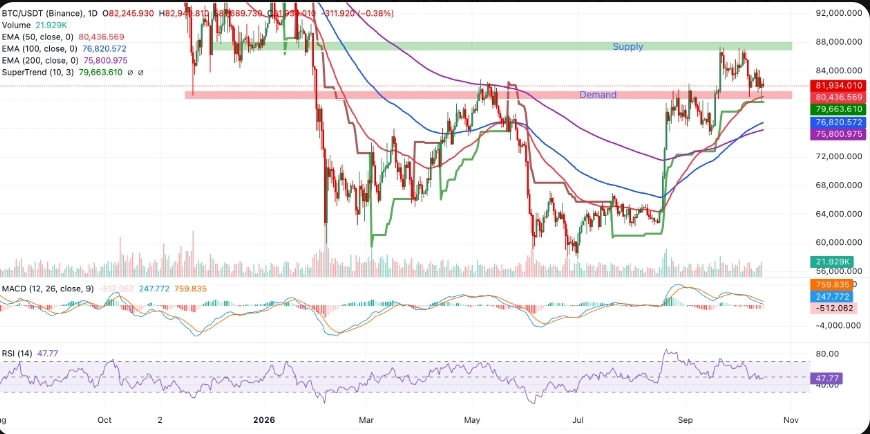
Bitcoin trading below $82,000 puts the short-term recovery under pressure, but I wouldn’t call the broader structure broken yet.
The first area I’m watching is around $80,400, close to the 50-day EMA. Below that sits the $79,660 SuperTrend level, which is arguably more important because it currently defines the short-term trend.
If those levels hold, Bitcoin still has room to stabilize.
The problem is overhead supply. The $84,000 region is the first meaningful obstacle, while roughly $87,000 represents a much tougher test. A recovery through those areas would give buyers considerably more evidence that the correction is losing control.
For now, I see a market trying to recover rather than one that has already confirmed a reversal.
Momentum Is Neutral, Not Convincing
The technical indicators tell a similar story.
Bitcoin’s RSI is around 48, which puts momentum close to neutral. MACD remains negative and below zero, so buyers haven’t yet established strong upside momentum.
What I find more interesting is the 30-day Consensus Index. It has moved from deeply negative territory into a more constructive reading, with the cited data showing a reading of +49.2 and a strong majority of analysts leaning bullish.
I wouldn’t use that alone to justify a trade. Sentiment can improve well before price actually confirms anything. Still, it provides useful context: expectations are becoming more optimistic even though the chart hasn’t fully caught up.
Gold Is Recovering, But the Trend Hasn’t Flipped Yet
Gold’s behavior is different.
XAU/USD has gradually moved back toward $4,200 after recently trading below $4,100. The positive MACD suggests that selling pressure is easing, and the recovery shows buyers are willing to defend lower levels.
But I’m not treating this as a confirmed bullish reversal.
Gold remains below several important moving averages, and the RSI near 46 is still below the midpoint. That tells me the recovery has momentum, but sellers haven’t completely lost control.
The first major resistance sits around $4,255, followed by a dense region between roughly $4,297 and $4,304. Beyond that, the SuperTrend near $4,360 and descending trend-line around $4,416 become the more important tests.
What Would Actually Change My View?
For Bitcoin, I’d want to see price reclaim $84,000 and then establish itself above the $87,000 area. Until that happens, I’m treating rallies as recovery attempts rather than confirmed trend changes.
For gold, the situation is similar. A sustained move through the $4,255-$4,304 resistance cluster would be much more meaningful than simply touching $4,200.
On the downside, Bitcoin losing the $79,660 area would weaken the near-term structure. Further losses could bring the $76,821 and $75,801 zones into focus.
Gold has its own decision point above the current price, with the $4,255-$4,416 region separating a simple rebound from a more convincing recovery.
My Takeaway
What I’m seeing is a market in transition rather than one with a clear direction.
Bitcoin has constructive structural support but lacks strong momentum. Gold has improved short-term momentum but remains technically below important resistance. Meanwhile, inflation and Fed expectations continue to influence both markets in different ways.
I’m therefore paying less attention to individual candles and more attention to confirmation. Support needs to hold, resistance needs to break, and macro expectations need to become clearer.
Until those pieces line up, patience makes more sense to me than trying to predict the next move from a single headline.
#BitcoinShortTermHoldersReach4.08MBTC #BitcoinRecoversTo$82K #GOLD #CryptoMarket #MacroEconomics
