

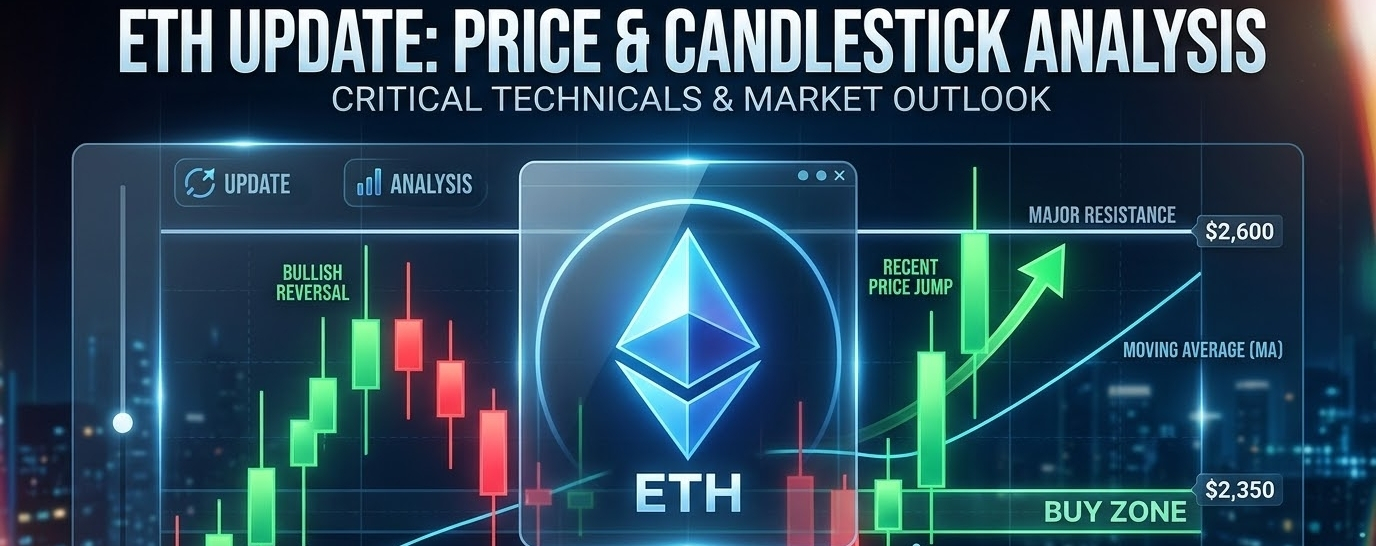

ETH UPDATE: Is Ethereum Preparing for a Rebound or Deeper Dip? 📊 🔥
Ethereum ($ETH ) is at a pivotal technical crossroad! After a sharp market shakeout and over $280M in long liquidations, buyers are battling to defend key demand zones.
Here is everything you need to know about current price action and what the candles are telling us! 📉📈
📌 Quick Price Breakdown
Current Price: ~$2,455 USD
Immediate Resistance: $2,490 – $2,500 (50-day EMA)
Key Support Zone: $2,350 – $2,370 (100-day EMA & Major Demand Zone) The Long Lower Wick (Hammer / Rejection Pin Bar) at $2,350:
What it means: Prices dumped down to $2,350 during liquidations, but aggressively bounced back up. This long lower wick shows heavy buyer absorption at lower support.
Resistance Rejection near $2,500:
What it means: Daily candle upper wicks around $2,490 show bears are actively selling near the 50-day EMA. $ETH needs a solid green daily close above $2,500 to flip the short-term trend bullish.
Consolidation Doji / Small Body Candles:
What it means: Indecision between buyers and sellers. Market momentum (RSI ~39) is currently cooling off, setting up for a high-volatility breakout move.
🎯 Key Scenarios to Watch
🟢 Bullish Case: A clean break and daily candle close above $2,500 invalidates seller momentum and opens the door for a rally toward $2,770 – $3,280.
🔴 Bearish Case: A breakdown below $2,350 exposes deeper support around the 200-day EMA near $2,300 - $2,250.
💬 What’s your play on $ETH ? Are you buying the dip or waiting for $2,500 breakout confirmation? Drop your thoughts below! 👇🔥