

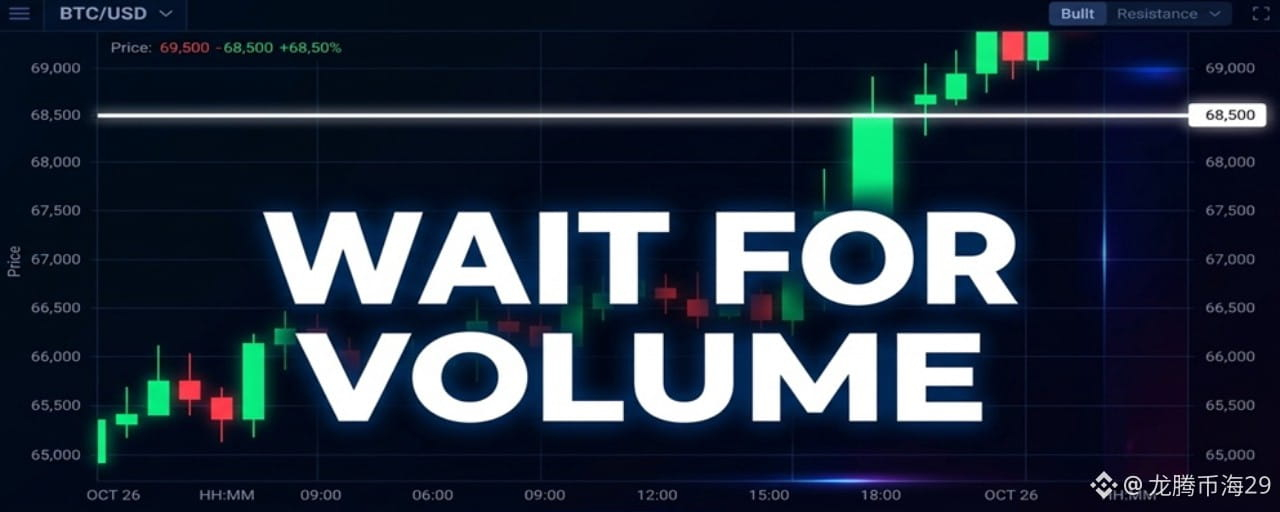

Everyone is watching the SUI chart right now. The price action has been grinding higher for weeks, pushing steadily into a major structural resistance zone. On the surface, it looks like a clean breakout is loading. But if you only look at the green candles, you are missing the warning signs hiding in the volume profile.
SUI has been one of the most resilient large-cap altcoins in the market. The fundamentals backing this price action are undeniably strong. Total Value Locked has climbed consistently, and daily decentralized exchange volume frequently rivals established networks. The Move virtual machine is actively attracting developers, particularly in the gaming and decentralized physical infrastructure sectors. The ecosystem is growing, and the token price is reflecting that underlying utility.
Let us examine the daily chart. SUI is currently pressing against the $4.00 to $4.20 supply zone. This area represents the upper boundary of the multi-month consolidation range. Every time the price has entered this zone over the past several months, sellers have stepped in aggressively to defend the level.
The momentum indicators offer a mixed signal. The daily Relative Strength Index is sitting around 62. This is a healthy reading that shows bullish momentum without being dangerously overbought. There is technically still room for the price to expand. However, the volume tells a more complicated story. While the price has made higher lows, the volume on the recent push into the resistance zone is declining compared to the initial breakout from the range lows. We are seeing a clear volume divergence. Price is making new local highs, but market participation is fading.
For this to become a sustained breakout rather than a bull trap, the buyers need to show absolute conviction. We need to see a daily candle close cleanly above $4.20. More importantly, that close needs to be accompanied by a massive spike in spot trading volume. If the price crosses $4.20 on average or declining volume, it is highly likely to be rejected back into the range.
If the buyers fail to clear this hurdle, the risks become immediate. If SUI gets rejected at this resistance and subsequently loses the $3.40 support level, the short-term market structure breaks down. The next logical area to test would be the $3.00 psychological zone, where a large amount of long liquidity is resting. Traders holding leverage need to be aware that a sweep of the recent swing lows could trigger a cascade of liquidations before any real recovery begins.
The fundamental story for this network is intact. The ecosystem is delivering real usage and attracting capital. But the market does not reward good fundamentals if the technical structure fails at a key level. Wait for the volume confirmation. Let the market prove the breakout is real before committing heavy capital. Patience is your best tool when trading major resistance zones.

Disclaimer: This article is for informational and educational purposes only and does not constitute financial advice. Cryptocurrency trading involves significant risk, and you may lose your invested capital. Always conduct your own research and manage your risk carefully.