





Access Binance OTC desk on the VIP Portal
Period: October 8 – October 15, 2026
Market Sentiment: Greed Gives Way to Neutral as the Cooldown Accelerates
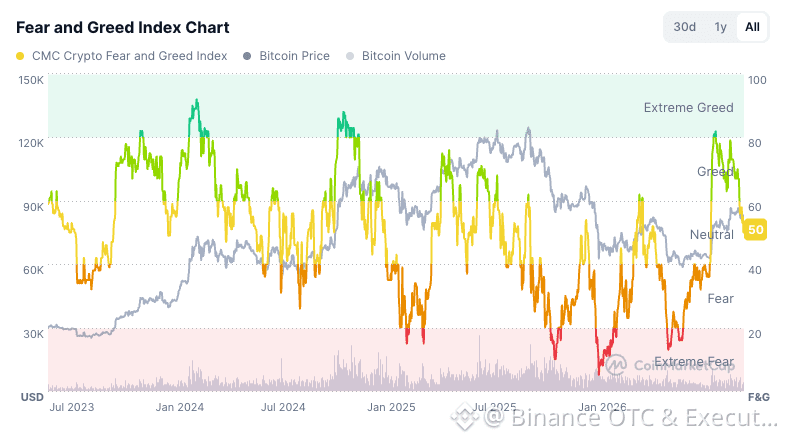
Market sentiment took a decisive step down this week, with the CoinMarketCap Fear and Greed Index printing 50 — landing squarely in Neutral territory and exiting the Greed zone entirely. The move is notable for its speed: the index has fallen from the 70 region to 50 in short order, following last week's 60 and the prior cycle's 70–80 range. What was previously a gentle drift lower has become a faster re-rating.
This is a meaningful character shift from last week's "orderly cooling." Where the prior reading reflected a market reverting from an overheated state while staying optimistic, this week's print signals that optimism itself is being trimmed, not just excess heat. The market has moved from "Greed, cooling" to "Neutral, hesitant" — a materially more cautious posture.
Key takeaways:
The Fear and Greed Index sits at 50, now in the Neutral zone.
The reading has dropped quickly from 70 to the 50 region.
Sentiment has exited Greed for the first time in the recent run.
The move reflects broad re-rating, not just cooling froth.
Optimism is being trimmed, not abandoned — Neutral, not Fear.
A Neutral print removes euphoria but leaves room for either direction.
Overall, the sentiment backdrop has shifted from supportive-but-temperate to genuinely cautious. The loss of the Greed reading is a clear signal that risk appetite is being reined in — and the burden of proof now sits squarely on whether Neutral holds or slides toward Fear.
Figure 1: Fear and Greed Index Chart
Price Action: BTC Slips to the Low-$80Ks as the Recovery Base Is Tested
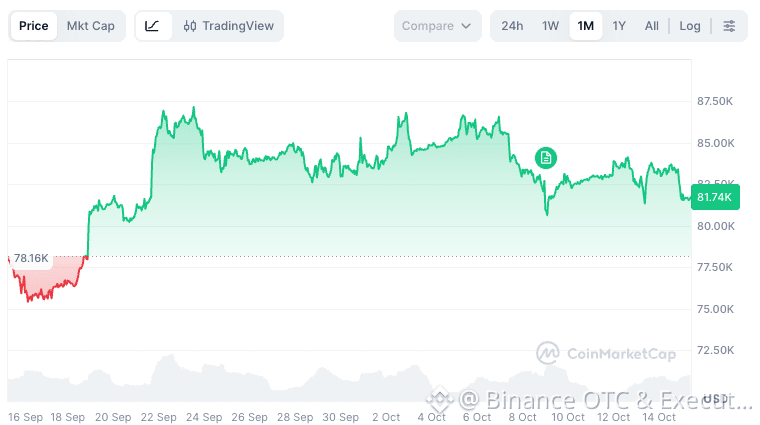
Bitcoin moved lower this week, easing from the prior cycle's mid-$80K consolidation into the 81K–82K region (last print ~$81.7K). The decline marks a step down from the $85K area that held through the previous week, and it puts the recovery base under visible pressure for the first time since September.
The structure is now soft-to-lower, a change from last week's flat consolidation. Having failed to reclaim the local high near $87.5K, price has drifted down through the mid-$80Ks and is now testing the lower end of its recent range. The September base built off the ~$78K low remains the deeper reference; the immediate question is whether the low-$80Ks can stabilise or whether the grind lower continues.
Key takeaways:
BTC has slipped to the 81K–82K region from last week's $85K area.
Price is testing the lower end of its recent range.
The prior local high near $87.5K remains unclaimed overhead.
The move extends a softening trend, not a breakout.
The ~$78K September low is the deeper base reference.
Follow-through now depends on whether buyers defend the low-$80Ks.
Overall, price action has moved from pause to mild pressure. BTC is still holding above its September base, but the loss of the mid-$80Ks shifts the burden onto dip demand — and without a fresh catalyst, the tape leans defensive.
Figure 2: Bitcoin Price Chart
ETF Flows: Institutional Demand Stays Flat with a Slight Outflow Bias
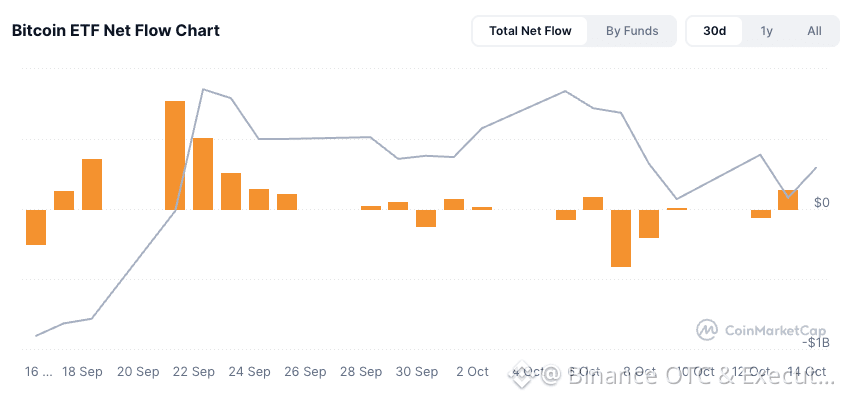
ETF flows remained stagnant this week, with net flows hovering near $0 and tilting to a slight outflow. After the prior cycle's ~$1.5B inflow wave and last week's flat-to-zero reading, the institutional bid has now gone from paused to modestly negative — a step further in the same cautious direction.
This extends the clearest sign of hesitation in the setup. Traditional allocators continue to observe rather than commit, and the marginal bias has shifted from "no signal" to "slight distribution." The scale-back remains a step down from the multi-billion-dollar weeks that framed the September recovery, leaving the market without its strongest source of structural demand.
ETF flow
BTC ETF net flows stayed roughly flat this week.
The bias tilted to a slight outflow.
The prior cycle's ~$1.5B inflow pace remains unsustained.
Traditional/institutional investors continue to hesitate and observe.
Flows are providing no positive directional signal.
Renewed inflows remain the key confirmation to watch.
Combined interpretation:
The flat-to-slightly-negative flow picture is a cautious signal for institutional sentiment.
Allocators stepping back suggests they are waiting for confirmation before re-engaging.
The mild outflow bias is a soft negative, though far from heavy distribution.
Flows now align with the Neutral sentiment and the softer price action.
The key question is whether this is continued digestion or the start of a deeper fade.
Overall, ETF demand has shifted from "waiting" to "waiting with a slight negative tilt." The absence of meaningful exit pressure keeps the base intact, but until institutional flows return, the market lacks the fuel that powered the prior leg higher.
Figure 3: ETF Net Flow Chart
Derivatives & Liquidations: Long Flush Clears the Last of the Over-Optimistic Leverage
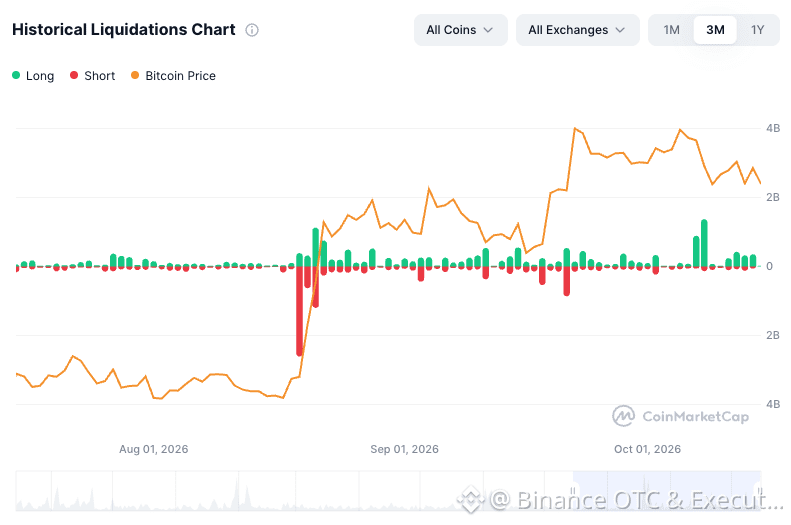
Derivatives activity again provided the week's most important structural event. Following the ~$890M long liquidation on October 7, a further round of long liquidations continued to clear over-leveraged, over-optimistic long positions, forcibly resetting positioning as price slipped from the mid-$80Ks. The pattern that began last week has extended: where the prior cycle saw shorts squeezed into rising prices, the recent phase has been one of longs being punished as momentum faded.
Importantly, this remains a reset rather than a break. The flush removes the froth that built up during the rally and lowers the overhang that made a larger cascade possible. With the leveraged long crowding now substantially cleared, the market is less prone to forced-squeeze dynamics — but it also means the mechanical support that leverage once provided is gone, leaving price more exposed to genuine demand, or the lack of it. In practice:
Continued long liquidations clear excess leverage built during the September run.
Removing over-leveraged longs reduces downside fragility going forward.
The event is a positioning reset, not a trend reversal on its own.
With leverage cleaned out, the market is less prone to a sharp cascade.
A quieter derivatives book shifts price sensitivity to flow and sentiment.
Key takeaways:
Long liquidations extended the prior week's flush.
The event cleared over-optimistic, over-leveraged longs.
This remains the inverse of the prior cycle's short squeeze.
The reset lowers structural fragility rather than confirming a downtrend.
Positioning is now cleaner, less crowded, and less supportive mechanically.
Derivatives sensitivity is reduced, shifting focus back to flows and price.
Overall, the derivatives picture remains a de-risking event — painful for over-leveraged longs, but constructive for market health. The prior cycle's overhang has been substantially relieved, leaving the market on firmer footing if demand returns — but with no leverage left to carry it in the meantime.
Figure 4: Historical Liquidations Chart
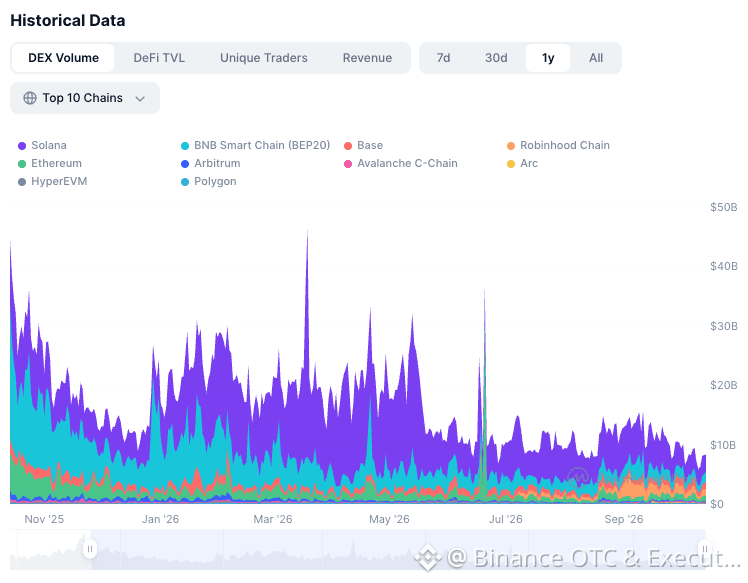
DEX & On-Chain Activity: Volume Falls Below $10B as Speculation Retrenches Further
On-chain activity deepened its cooldown. DEX volume slipped below $10B, extending the early-October slowdown and leaving activity significantly weaker than the ~$20B levels seen through the first half of the year. The decline remains broad-based across Solana, BNB Chain, Base, and Ethereum alike — a market-wide retrenchment rather than an isolated dip.
The absence of any on-chain impulse reinforces the read from flows and sentiment: speculative activity is retrenching further, and the market is no longer chasing risk at anything like the pace seen during the ramp. The step below the $10B line is a notable level break — it puts aggregate activity at roughly half its first-half run-rate and confirms that the cooling is deepening rather than stabilising.
Key takeaways:
DEX volume has fallen below $10B.
Activity is now roughly half the ~$20B first-half run-rate.
The pullback remains broad-based across major chains.
On-chain activity confirms the deepening cooldown theme.
Declining volume reflects further retrenching speculative appetite.
A quiet on-chain backdrop is consistent with Neutral sentiment and soft flows.
Overall, on-chain activity continues to align with the rest of the the market is stepping back decisively from its September intensity and settling into a quieter, more cautious phase.
Figure 5: DEX Volume Chart
Weekly Assessment
The market cooled further during the week of October 14, with sentiment, price, flows, derivatives, and on-chain activity all pointing to a deepening cooldown — and, this week, to a market that is further from recovery than a week ago.
Sentiment fell to 50 on the Fear and Greed Index, down from 60 and out of the Greed zone entirely — a fast move from optimism to Neutral. BTC price action matched this, slipping to the 81K–82K region from last week's $85K area and testing the lower end of its range beneath the $87.5K overhead reference.
ETF flows stayed stagnant with a slight outflow bias, keeping the institutional bid on the sidelines and reinforcing that traditional allocators are hesitating and observing rather than committing. On derivatives, long liquidations continued to clear over-leveraged, over-optimistic positions — a contained reset that relieves fragility but also removes the mechanical support leverage once provided. On-chain, DEX volume fell below $10B, roughly half the ~$20B first-half run-rate and the clearest confirmation yet of the broad retrenchment in speculative activity.
Overall, the market remains orderly but clearly still transitioning out of its overheated phase — and the transition is not yet complete. Confidence has cooled, the recovery base is being tested, and the long-side froth has been largely cleared. All of that is constructive for market health over time. But the takeaway this week is simple: the market is far from recovery and needs obviously more time — and more confidence — before a durable turn can take hold. The answer will likely come from institutional flows: if ETF demand returns to confirm the base above the low-$80Ks, the cooling will read as healthy consolidation. If flows stay quiet or tilted negative, the market's next move will depend more on positioning than on new demand — and the burden of proof stays firmly with the bulls.
Why trade OTC?
Binance offers our clients various ways to access OTC trading, including chat communication channels and the Binance OTC platform (https://www.binance.com/en/otc) for manual price quotations and execution services.
Email: trading@binance.com for more information.
Join our Telegram Channel @BinanceOTCTrading (https://t.me/+0mkJQnbQiOdlZjk0) to stay up to date with the markets!
You can also reach out to us on Telegram (@Binance_OTC_Desk) to connect directly with our experienced traders for your OTC trading needs. We look forward to assisting you and providing exceptional service for all your OTC transactions.