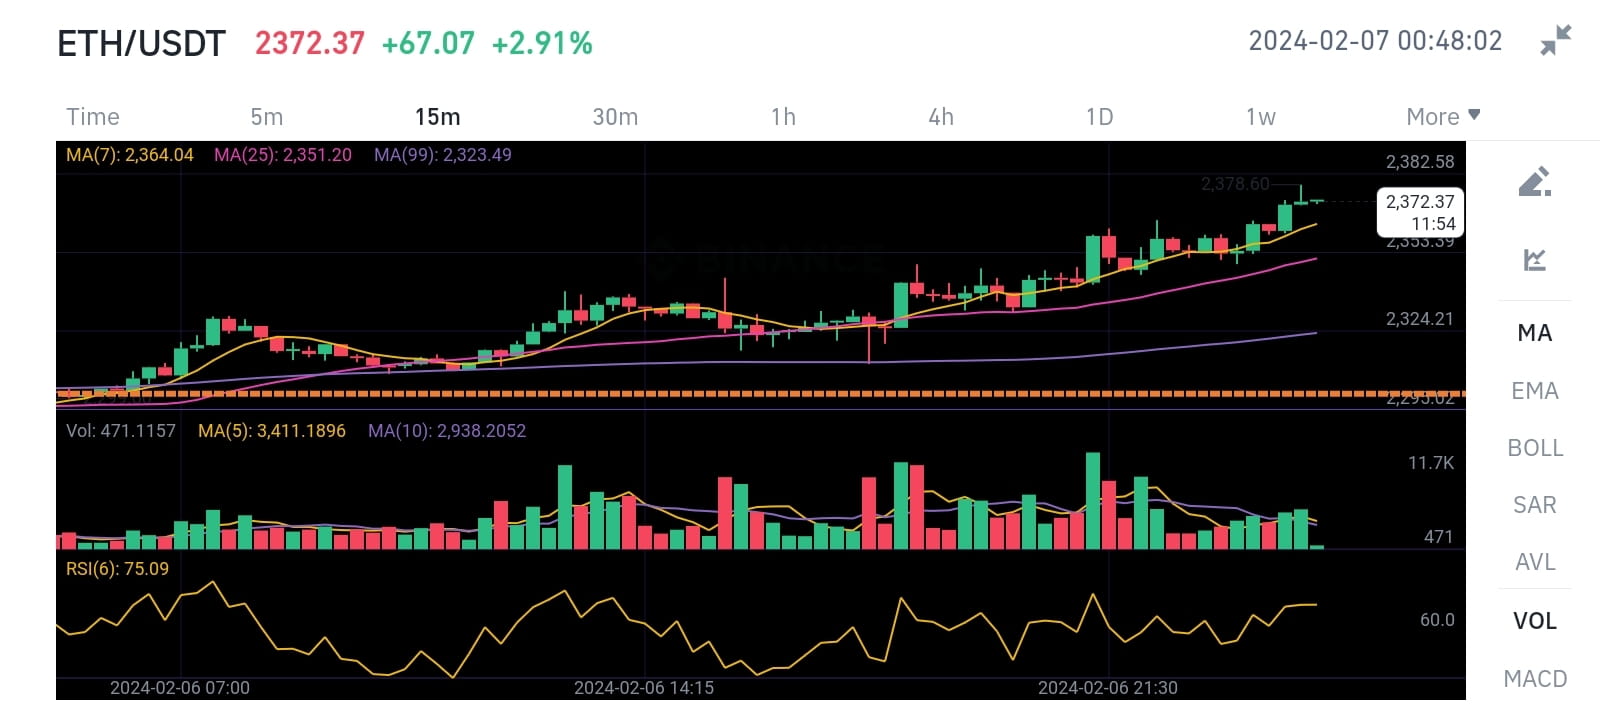
$ETH This is my technical analysis for this chart. I hope you find it helpful. 😊
The support can be identified around the price of 2324.21 USDT where the price has bounced back up previously. This level also coincides with the MA99 line, which adds to its strength as a support. If the price breaks below this level, it could indicate a bearish trend and the next support could be around 2300 USDT where the price has found support in the past.
The resistance point is likely near the current high in this image at 2372.37 USDT. This level is also close to the RSI overbought zone, which suggests that the price might face some selling pressure and pull back. If the price breaks above this level, it could indicate a bullish trend and the next resistance could be around 2400 USDT where the price has faced resistance in the past.#Write2Earn #Write2Earn #Write2Earn