


◆━━━━━━━━━━━━━━━━━━━━◆
Bitcoin is drifting lower, and the mood across trading desks and crypto timelines is getting heavier.
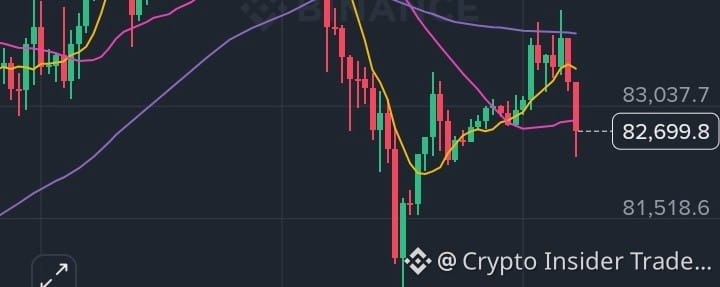
BTC is trading around $82,692, down approximately 0.49% on the day. Just four days ago, it was approaching $87,000.
Is this a temporary reset, or could the correction deepen?
Let's break down the chart, key levels, and broader market backdrop without the hype.
◆━━━━━━━━━━━━━━━━━━━━◆
◆ ① THE MARKET SNAPSHOT
BTCUSDT Perpetual | 4H Chart
➤ Last Price: 82,692.4
➤ 24H High / Low: 84,326.4 / 82,358.7
➤ 24H Volume: 28.08K BTC (≈ 2.35B USDT)
➤ Open Interest: ≈ 1.4B USDT
The 24-hour trading range is relatively tight, but Bitcoin is trading near its lower boundary. This suggests sellers currently have the short-term initiative.
The key question is whether buyers can defend support or selling pressure will continue.
◆━━━━━━━━━━━━━━━━━━━━◆
◆ ② WHAT THE 4H CHART IS TELLING US
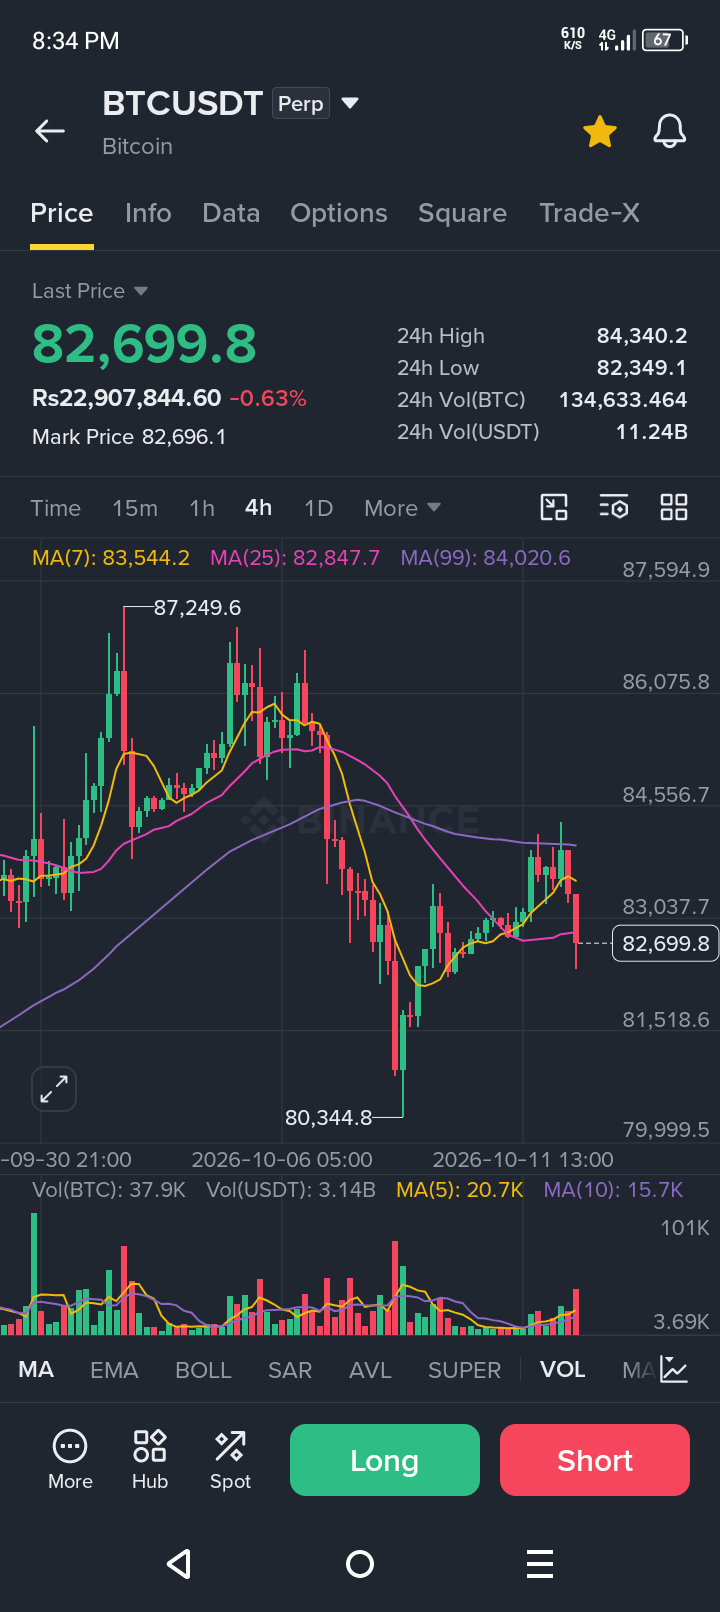
✔︎ MA(5): 83,466.9
✔︎ MA(10): 83,369.7
✔︎ MA(20): 83,090.6
Bitcoin is trading below all three moving averages. Short-term momentum is cooling, and the averages are beginning to slope downward.
Market structure matters, too.
BTC recently recorded a swing high near $87,222 and a swing low around $80,379. Price is now positioned in the middle-to-lower portion of that range, while the latest candle shows strong selling pressure.
Volume adds another clue.
➤ Latest volume: approximately 7.96K
➤ Five-period average: approximately 4.18K
The latest volume bar is significantly above its recent average, suggesting that the downward move has attracted increased market participation.
However, volume alone cannot confirm whether the decline will continue.
◆━━━━━━━━━━━━━━━━━━━━◆
◆ ③ KEY LEVELS TO WATCH
➤ Resistance Zones
① $83,000–$83,500 — Moving-average cluster
② $84,137 — Additional resistance reference
➤ Support Zones
① $82,064 — Nearby support reference
② $80,379 — Recent swing low
These levels are reference zones, not guaranteed turning points.
A sustained move above resistance could indicate improving short-term momentum. Conversely, a breakdown below support could expose Bitcoin to additional volatility.
The reaction around these areas may provide more information than price predictions alone.
◆━━━━━━━━━━━━━━━━━━━━◆
◆ ④ WHY IS BITCOIN UNDER PRESSURE?
Several factors have contributed to the cautious market environment.
① Leverage Liquidations
Bitcoin moved below $84,000 as leveraged bullish positions were liquidated, with approximately $550 million in liquidations reported.
② Macroeconomic Pressure
Dollar strength and elevated US Treasury yields have added to market uncertainty. The 10-year US Treasury yield was reported above 5.2% during the same period.
③ Spot Bitcoin ETF Outflows
Reported outflows exceeding $600 million have added another factor for market participants to monitor.
④ Defensive Options Positioning
The one-week put-call skew reportedly rose to approximately 10%, suggesting greater demand for downside protection in the options market.
⑤ Flash-Crash Anniversary Concerns
Bitcoin recently touched a one-month low just above $80,000 as the anniversary of the October 10, 2025 flash crash approached.
Taken together, these factors help explain the cautious sentiment, although none independently determines Bitcoin's next move.
◆━━━━━━━━━━━━━━━━━━━━◆
◆ ⑤ THREE SCENARIOS TO WATCH
Rather than predicting a single outcome, consider three possible paths.
➤ ① Bullish Scenario
Bitcoin reclaims the $83,000–$83,500 moving-average cluster with stronger volume. This could suggest that selling pressure is easing and the pullback may be stabilizing.
➤ ② Neutral Scenario
BTC continues moving between approximately $82,000 and $84,000 as traders assess macroeconomic developments and market positioning.
➤ ③ Bearish Scenario
Bitcoin loses nearby support and moves toward the $80,379 swing-low area, potentially accompanied by increased volatility.
Wintermute also identified $82,500 as an important downside level, placing it close to the current price in this snapshot.
The key is confirmation. Price reactions, trading volume, and broader market conditions can help distinguish between these scenarios, but no scenario is guaranteed.
◆━━━━━━━━━━━━━━━━━━━━◆
◆ ⑥ THE BIGGER LESSON: TRADING PSYCHOLOGY
Red candles can feel personal. But markets don't respond to our emotions.
✔︎ A pullback after a failed attempt to approach $87K is part of normal market behavior.
✔︎ Clearly defined levels and appropriate risk management matter more than confident predictions.
✔︎ A trading plan prepared before a major move can help reduce emotional decisions.
✔︎ Not every candle needs to become a trading opportunity.
The goal isn't to catch every move. It's to manage risk consistently and remain disciplined through different market conditions.
◆━━━━━━━━━━━━━━━━━━━━◆
◆ RESET OR DEEPER CORRECTION?
Bitcoin is facing short-term pressure, trading below its key moving averages and near important support zones amid broader macroeconomic uncertainty.
The next reaction around $82,000–$82,500 on the downside and $83,000–$83,500 on the upside may provide useful clues about short-term momentum.
For now, the chart presents a market that requires careful observation rather than certainty.
Levels provide context. Confirmation provides evidence. Risk management remains essential.
What's your view? Is Bitcoin experiencing a healthy reset, or could the correction extend further?
Share this analysis with a trader who follows BTC.
Follow for more clear, educational, and no-hype market breakdowns.
◆━━━━━━━━━━━━━━━━━━━━◆
◆━━━━━━━━━━━━━━━━━━━━◆
#BitcoinOptionsVolatilityHitsFiveYearLow #BitcoinReclaims$84K #FSBWarnsCrossBorderStablecoinRulesRemainUnderdeveloped #TokenizedStockMarketCapHitsRecord$3.9B #EthereumSpotETFsSee$542MNetOutflowLastWeek
