



Zcash (ZEC) is trading around $1,224.24, up approximately 0.64% over 24 hours, according to the latest Binance chart screenshots.
Despite relatively modest daily gains, ZEC is approaching an important resistance zone. The key question is whether buyers can regain momentum above $1,250 or whether selling pressure will keep the price under resistance.
📊 1H Chart: A Key Resistance Test
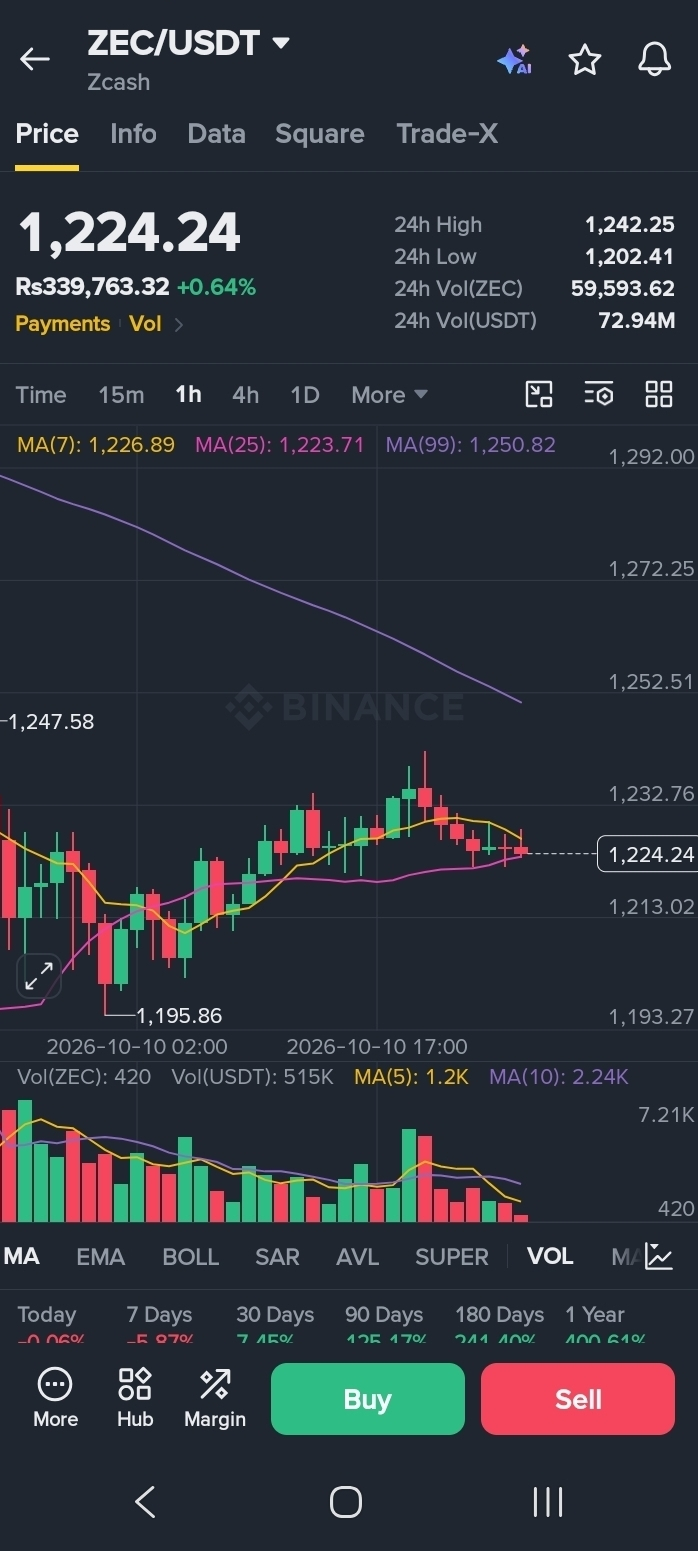
The 1-hour chart shows the following moving averages:
MA(7): $1,226.89
MA(25): $1,223.71
MA(99): $1,250.82
ZEC is trading close to its shorter-term moving averages but remains below the MA(99). This suggests that short-term momentum is mixed, with $1,250 acting as an important area to watch.
A sustained hourly close above this zone, supported by stronger volume, could improve the recovery outlook.
📉 1D Chart: Recovery Still Needs Confirmation
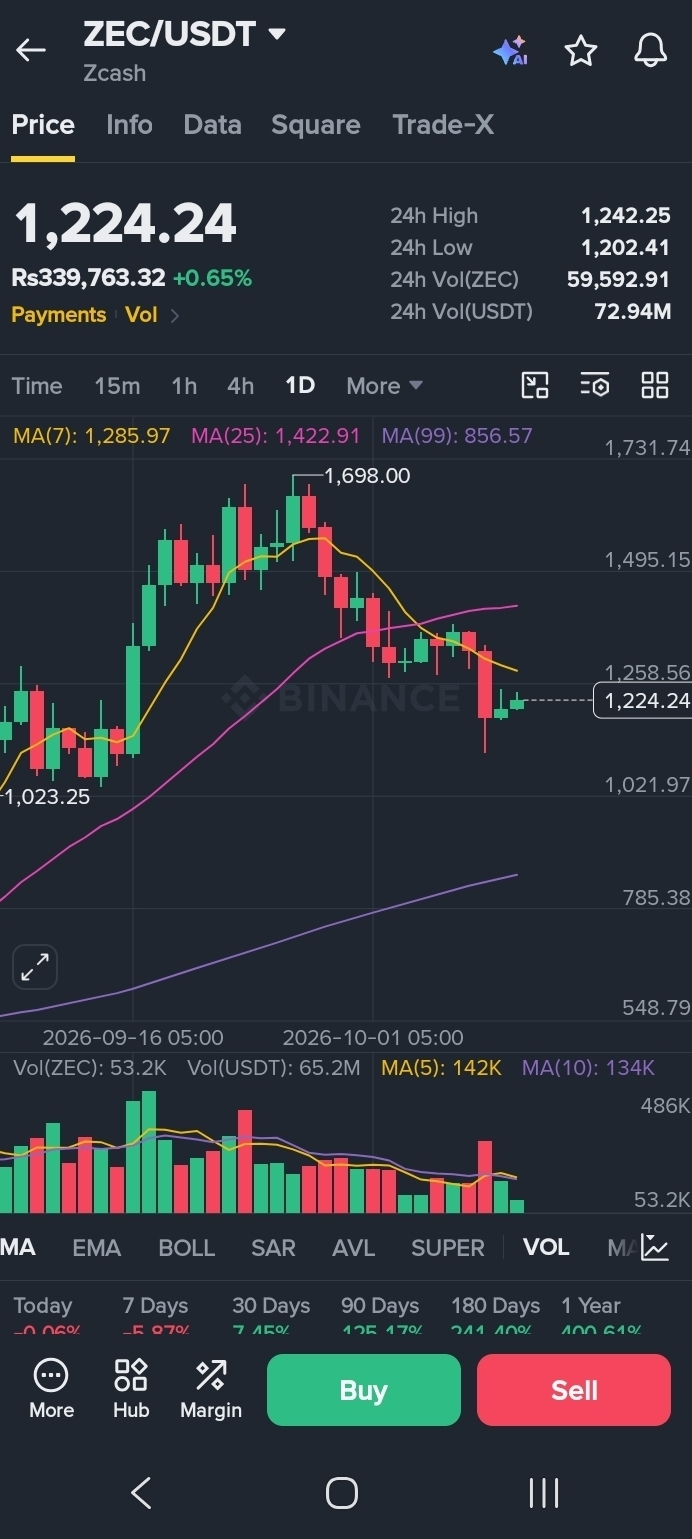
The daily chart provides a more cautious picture:
MA(7): $1,285.97
MA(25): $1,422.91
MA(99): $856.57
ZEC remains below its daily MA(7) and MA(25), indicating that the broader recovery has not yet been confirmed.
The $1,272–$1,286 area could become the next resistance zone if buyers manage to push the price higher.
🎯 Key Price Levels to Watch
Resistance zones
$1,242–$1,251: Immediate resistance
$1,272–$1,286: Next potential hurdle
Support zones
$1,213–$1,202: Near-term support
$1,195: Lower support reference
These levels are based on the supplied chart screenshots and are not guaranteed targets.
🔍 What Could Happen Next?
Bullish scenario: A sustained move above $1,251 with stronger volume could bring the $1,272–$1,286 zone into focus.
Neutral scenario: If ZEC remains between nearby support and resistance, price consolidation may continue.
Bearish scenario: A break below $1,202 could increase downside pressure and put the $1,195 area back in focus.
📝 Final Thoughts
ZEC is approaching an important technical decision zone. The 1-hour chart shows mixed momentum, while the daily chart suggests that a stronger recovery still needs confirmation.
For now, $1,250 is the key level to watch. A confirmed move above resistance could strengthen the recovery case, while a loss of support would increase the risk of another pullback.
Rather than reacting to short-term price movements alone, traders can monitor candle closes, trading volume and confirmation across both timeframes.
Disclaimer: This article is for informational and educational purposes only and is not financial advice. The analysis is based on the supplied Binance screenshots and may become outdated as market conditions change. Always conduct your own research and manage risk carefully.
#ZEC #Zcash #CryptoAnalysis #BinanceSquare #TechnicalAnalysis #CryptoMarket