

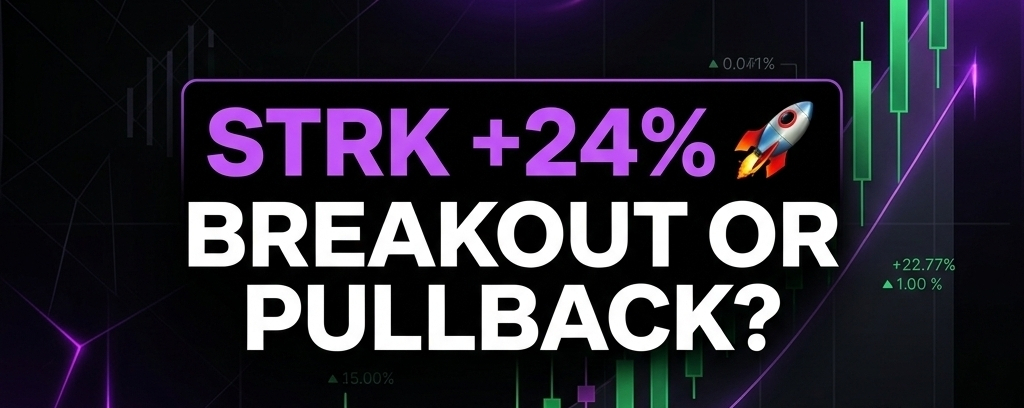

Starknet (STRK) is drawing attention after a strong rally, with STRK/USDT trading near $0.06965, up approximately 24.33% in 24 hours, according to the supplied Binance screenshots.
Trading volume has also been elevated, putting the spotlight on whether buyers can push the price higher or whether the market needs a cooldown.
Let's break down the 1H and 1D charts.
📊 1H CHART ANALYSIS — Short-Term Pressure
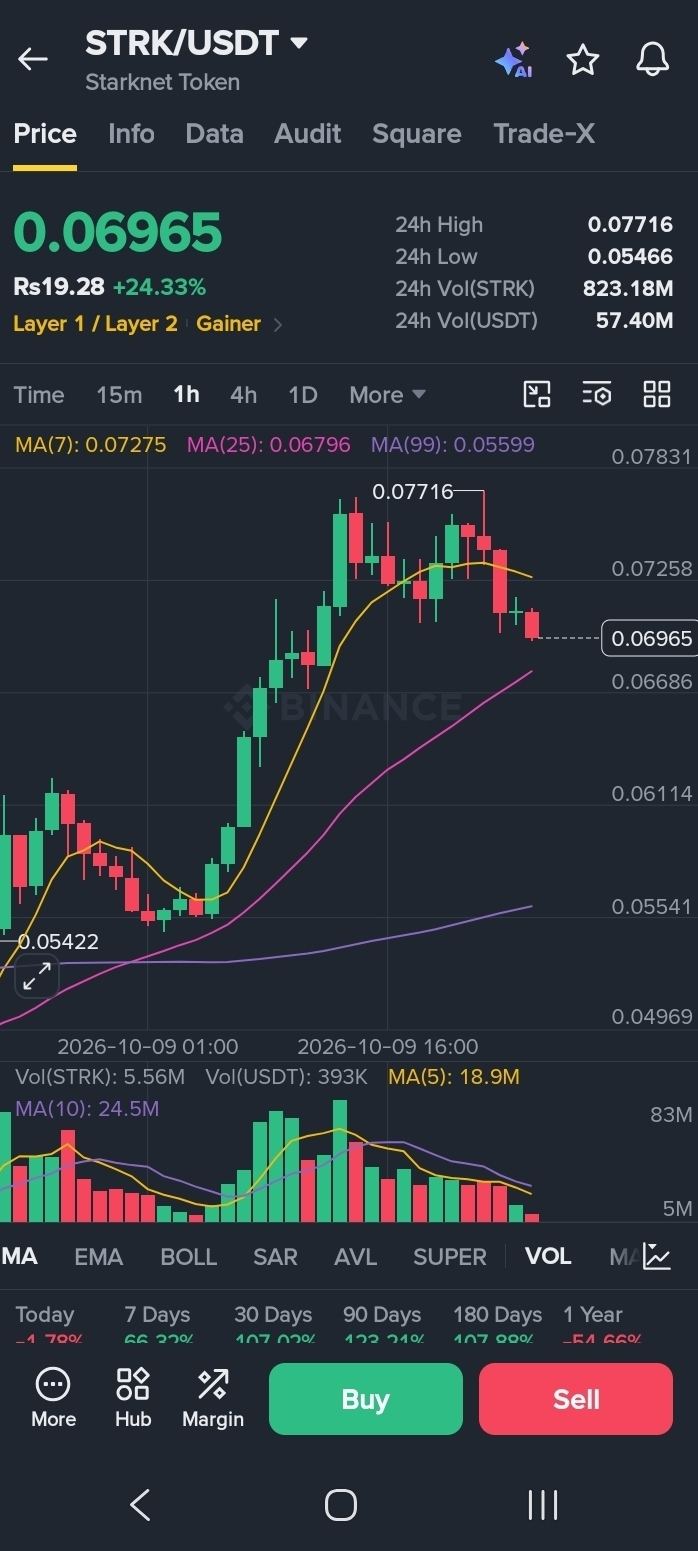
Current price: $0.06965
The 1H chart shows the following moving averages:
MA(7): $0.07275
MA(25): $0.06796
MA(99): $0.05599
STRK is currently below its 7-period moving average but remains above its 25-period and 99-period averages.
This suggests that short-term momentum has cooled after the rally, even though the broader structure on this timeframe remains constructive.
Key 1H levels:
Resistance: $0.07275
Major resistance: $0.07716
Near support: $0.06796
Lower support: $0.061–$0.056
A move back above $0.07275 could signal renewed short-term strength. If price loses the $0.06796 area, traders may watch for a deeper pullback.
📈 1D CHART ANALYSIS — Broader Bullish Structure
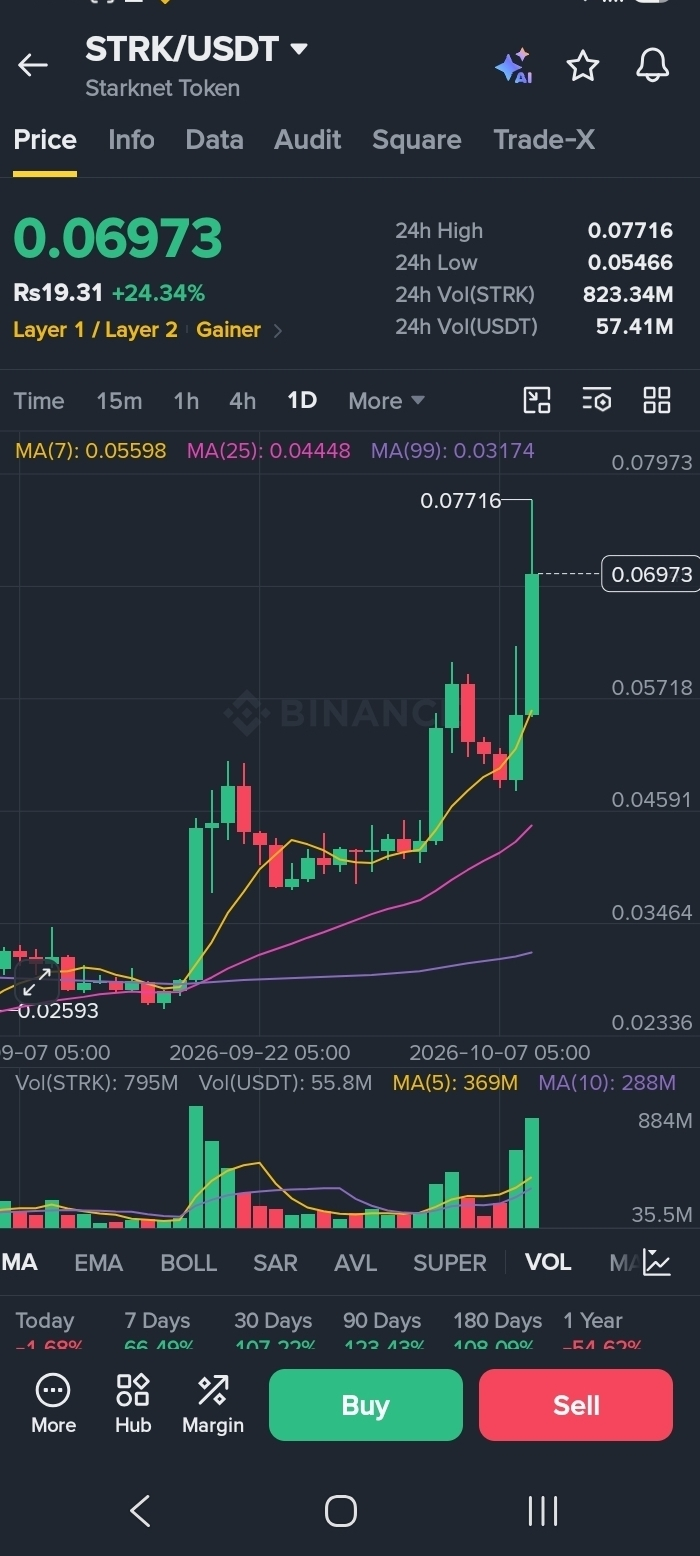
The daily chart presents a stronger picture:
MA(7): $0.05598
MA(25): $0.04448
MA(99): $0.03174
STRK is trading above all three daily moving averages, indicating strong upward momentum on the broader timeframe.
However, the price has moved sharply in a short period. Daily bullish momentum does not rule out volatility or profit-taking.
Key 1D levels:
Immediate resistance: $0.07716
Support zone: $0.056–$0.055
Deeper support: $0.0445
A sustained move above $0.07716 could strengthen the breakout case. Failure to hold support could weaken the current setup.
🐂 BULLISH SCENARIO
If STRK regains $0.07275 and then breaks above $0.07716 with convincing volume, traders may look for further continuation.
🐻 PULLBACK SCENARIO
If sellers remain active below $0.07275, STRK could revisit $0.06796 or lower support areas. A strong rally can reverse quickly, so chasing green candles carries risk.
🔍 FINAL TAKE
The 1H chart signals a short-term cooldown, while the 1D chart remains bullish based on the displayed moving averages.
The next key question is whether buyers can reclaim $0.07275 and challenge the $0.07716 high.
What do you think? 🚀
Will STRK break above $0.07716, or will profit-taking push it lower first?
Share your analysis below. 👇
Disclaimer: This post is for educational purposes only and uses the supplied Binance screenshots. It is not financial advice or a buy/sell recommendation. Cryptocurrency markets are volatile, and perpetual futures involve leverage and liquidation risks. Always conduct your own research.
#STRK #Starknet #CryptoAnalysis #TechnicalAnalysis #BinanceSquare #altcoins