



Polkadot (DOT) is gaining momentum, with DOT/USDT trading around $1.210, up approximately 12.66% in 24 hours in the provided Binance screenshot.
Both the 1-hour and daily charts show price trading above key moving averages. But can DOT break through resistance and extend its rally?
Let's examine the technical picture. 👇
📊 1H CHART ANALYSIS — Short-Term Momentum
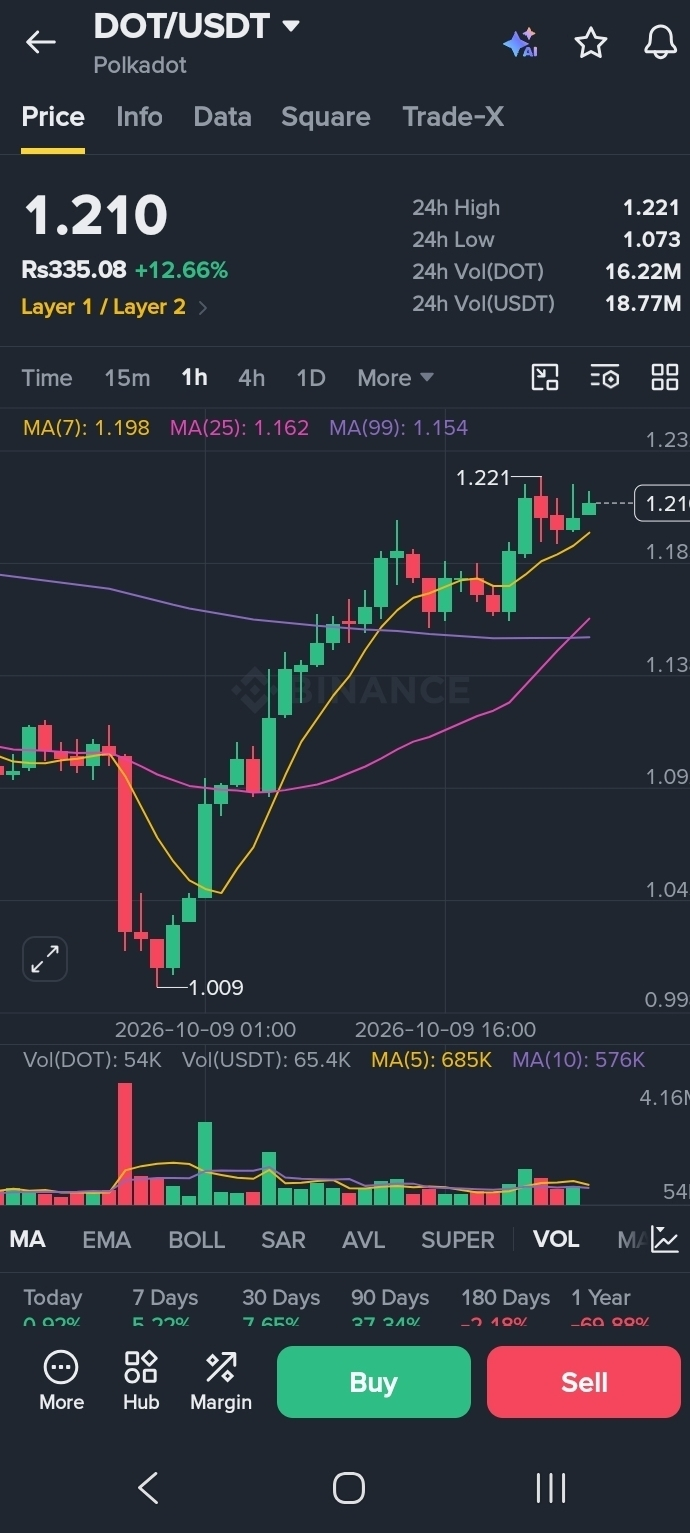
Current price: $1.210
The 1H chart shows DOT trading above all three displayed moving averages:
MA(7): $1.198
MA(25): $1.162
MA(99): $1.154
This structure suggests positive short-term momentum. Holding above the $1.198 area could help buyers maintain control, while a move below it may signal weakening momentum.
Key 1H levels:
Resistance: $1.221–$1.232
Near support: $1.198–$1.185
Lower support: $1.162–$1.154
A sustained breakout above $1.232, supported by stronger volume, would provide a more convincing bullish signal.
📈 1D CHART ANALYSIS — The Bigger Picture
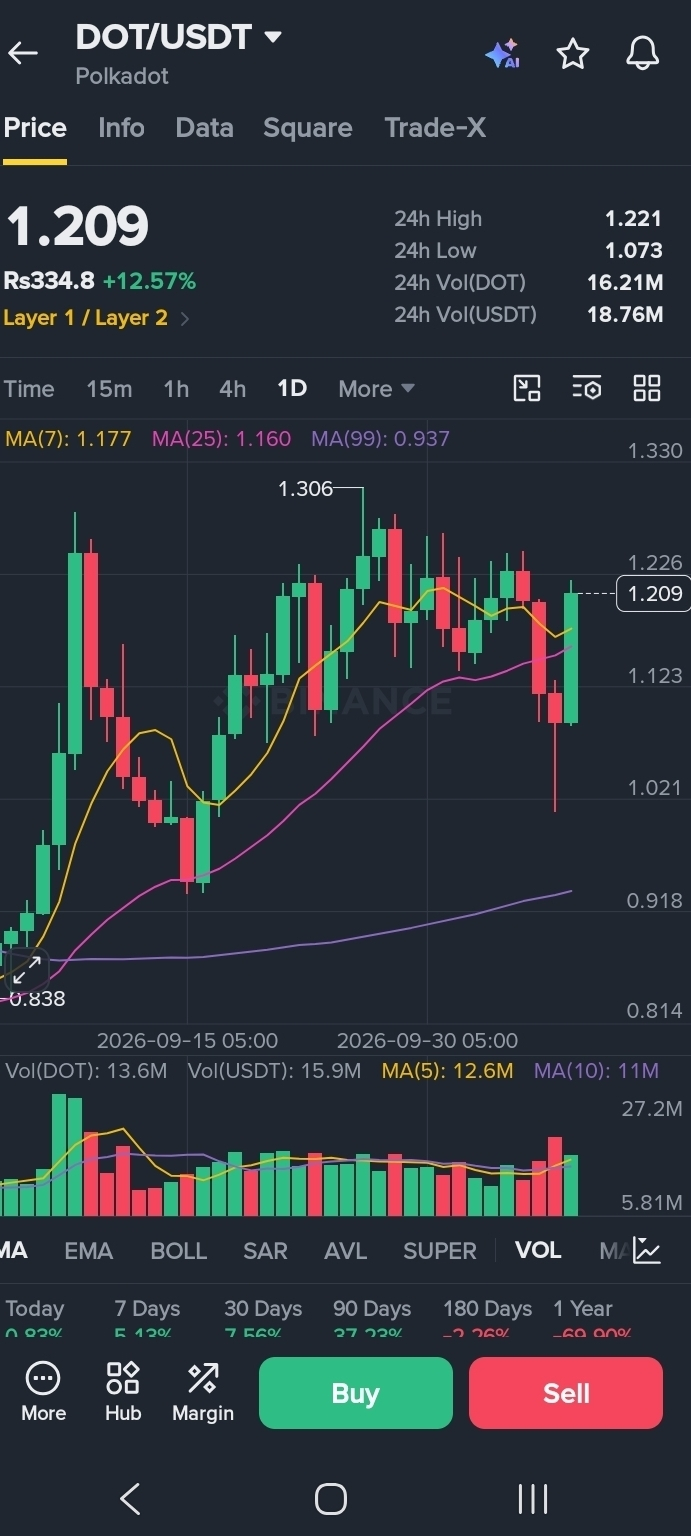
The daily chart also shows a constructive moving-average structure:
MA(7): $1.177
MA(25): $1.160
MA(99): $0.937
DOT is trading above all three averages, suggesting that the broader trend has strengthened. However, a sharp rally alone does not guarantee that the price will continue higher.
Key 1D levels:
Immediate resistance: $1.221–$1.232
Next resistance zone: $1.30–$1.33
Support area: $1.177–$1.160
Deeper support: Around $0.937
A sustained move above resistance would strengthen the bullish case. If the rally loses momentum, the moving-average zones may become important areas to monitor.
🐂 BULLISH SCENARIO
If DOT breaks above $1.232 and holds the breakout, traders may watch the $1.30–$1.33 zone as the next potential resistance area.
Confirmation through price action and trading volume will be important.
🐻 BEARISH SCENARIO
If DOT fails to break resistance, profit-taking could push the price toward $1.198–$1.185. A deeper correction could bring the $1.162–$1.154 support zone into focus.
🔍 FINAL TAKE
The 1H chart highlights short-term momentum, while the 1D chart provides a broader trend perspective. Both currently look constructive based on the supplied moving averages, but DOT still needs to overcome resistance.
What's your view? 🚀
Will DOT break above $1.232 and move toward $1.30, or will sellers trigger a pullback first?
Share your analysis below. 👇
Disclaimer: This post is for educational purposes only and is based on the supplied Binance chart screenshots. It is not financial advice or a buy/sell recommendation. Cryptocurrency markets are volatile, and perpetual futures trading carries additional leverage and liquidation risks. Always do your own research.
#DOT #Polkadot #CryptoAnalysis #TechnicalAnalysis #BinanceSquare #altcoins