



#PYTH is showing a strong recovery with positive momentum. However, the price has already made a sharp upward move, so buying immediately at the current level could carry more risk than waiting for a pullback or a confirmed breakout.
Follow these instructions to get gain.
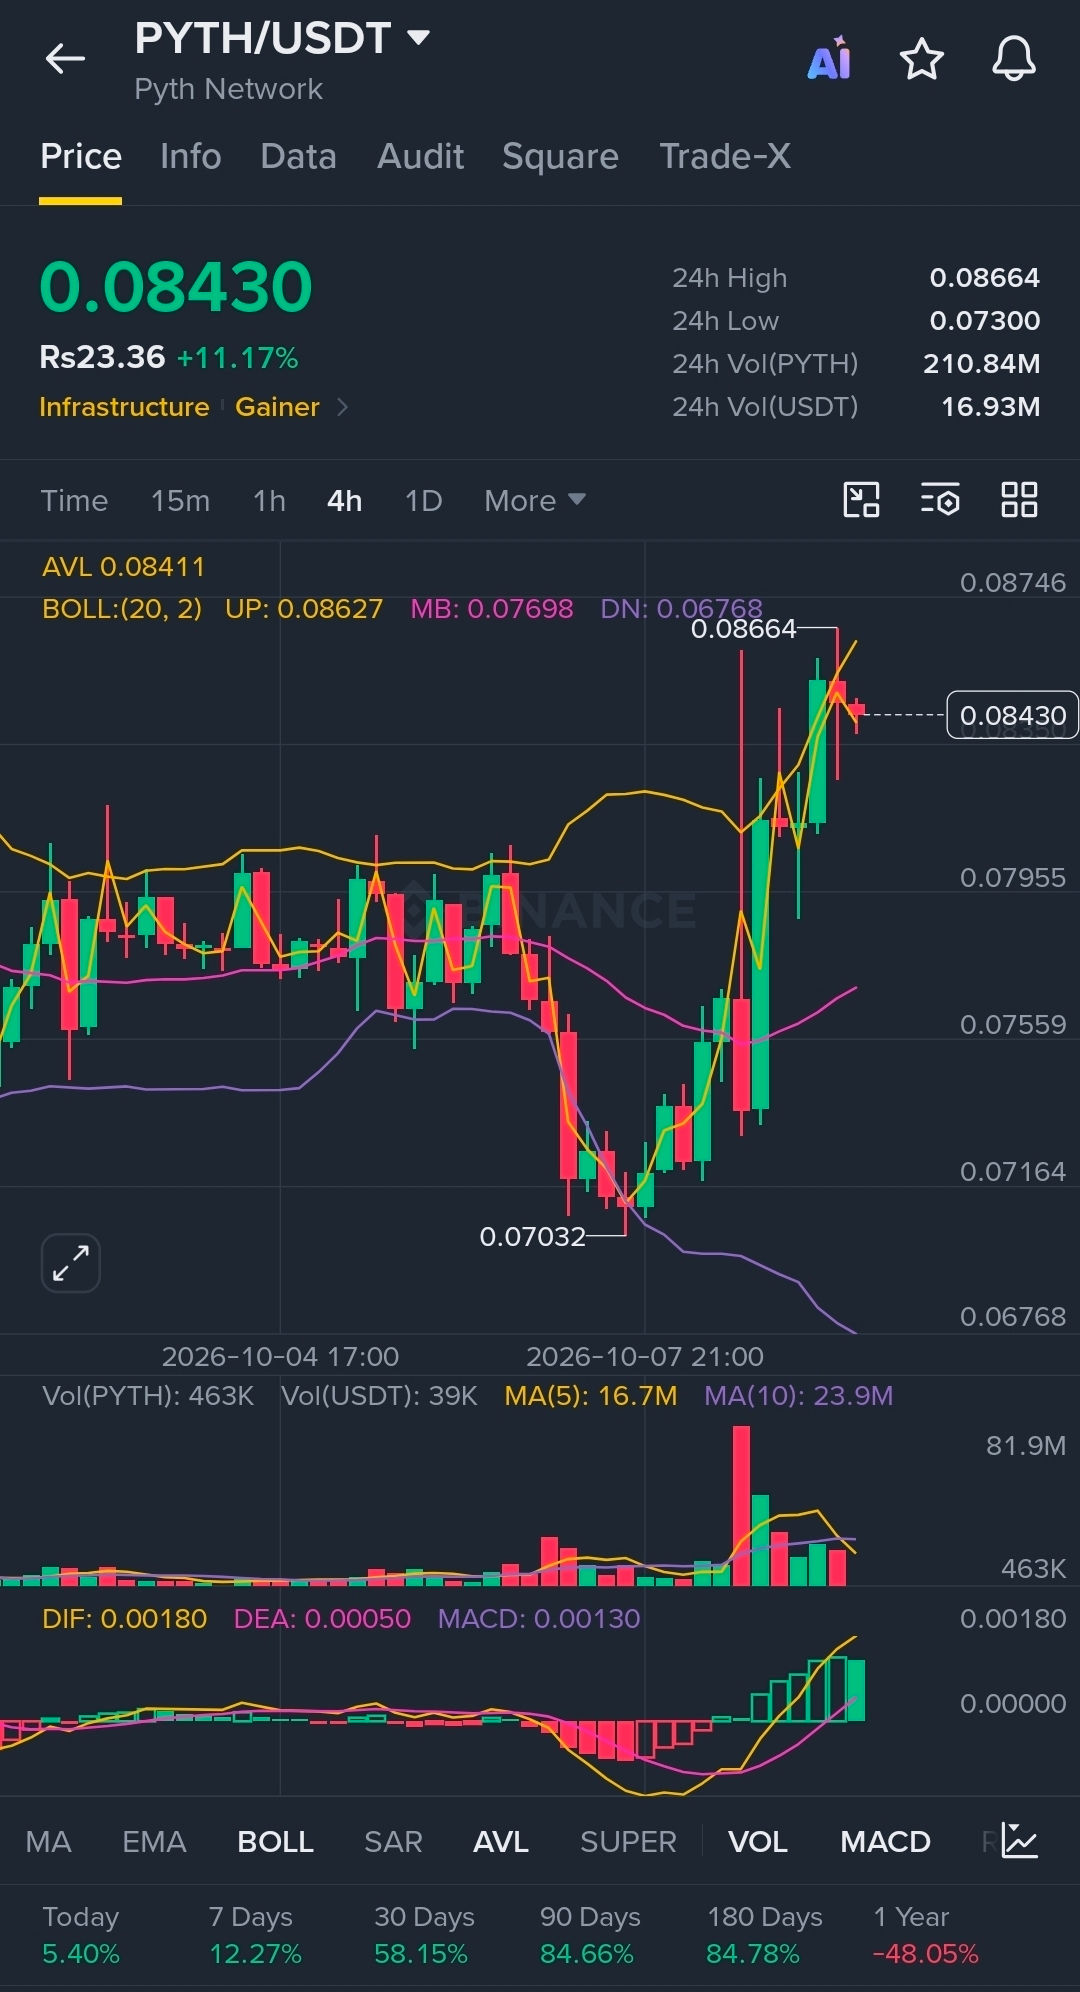
My view from this chart is bullish in the short term, but a fresh spot entry needs confirmation.
➡️ Current market situation:-
It's current price is 0.08430 USDT, +11.17% shown
24-hour high: 0.08664
24-hour low: 0.07300
#PYTH is recovering from around 0.07032 and climbing rapidly toward 0.08664. This is a substantial rebound, and the recent green candles indicate that buyers have been more aggressive than they were during the preceding decline.
But the latest candles are pulling back from the local high. That means buyers should now watch whether the price can hold its gains instead of assuming that the rally will continue immediately.
➡️ Important support and resistance levels:-
These are approximate levels based on the visible chart, not guaranteed price floors or ceilings.
0.0863–0.0867
➡️ Resistance zone:-
The upper Bollinger Band and recent high are close together. A confirmed breakout above this area could support another upward move.
0.081–0.082
A possible short-term area to watch if the price retraces from its recent high. Look for buyers to defend it rather than assuming it will hold.
0.0795
➡️ Important support;-
This is a visible chart level around the previous trading range. Losing it could weaken the current recovery.
0.0770
The middle Bollinger Band is around 0.07698. A deeper correction toward this area would mean the rally has lost some of its strength.
➡️ Bollinger Bands: Price is near the upper band
The upper band is around 0.08627, while the price is 0.08430. This shows that the price has moved toward the upper side of its recent volatility range. It supports the bullish momentum reading, but also warns against chasing a fast move.
The DIF is 0.00180 and the DEA is 0.00050. Both the positive difference and green histogram bars suggest upward momentum remains in place. However, momentum can weaken even while the indicator remains positive.
➡️ Volume:
Trading volume expanded sharply during the rise. That makes the recovery more meaningful than a move on very thin volume. The latest bars appear smaller than the biggest surge, so the next candles should show whether buyers still have enough strength to challenge resistance.
The combination of a positive MACD, a strong rebound and rising volume favors the bulls. The main concern is that PYTH has already advanced considerably from its recent low and is approaching resistance.
A rejection near 0.0866 followed by lower highs would be a warning sign. On the other hand, a strong 4-hour candle closing above resistance, with healthy volume and a successful retest, would make the bullish case stronger.
👉🏻 What is PYTH Network, and why does it matter?
#Pyth Network provides financial market data to smart contracts and applications across more than 100 blockchains. Its oracle infrastructure draws data from exchanges, market makers and other first-party providers.
PYTH is the network's governance token. It can be staked for governance participation and oracle integrity, so the project has uses beyond price speculation.
There is also a recent development worth monitoring. On October 8, 2026, Pyth announced that the DAO had committed all revenue it receives from Pyth products to its PYTH Reserve. The project reported $11.5 million in annualized recurring revenue for September 2026. This could strengthen the project's token accumulation narrative, but it does not guarantee that the market price will rise.
For a spot investor, the key question is whether network adoption and token-related demand continue to grow while the chart maintains a healthy structure.
👉🏻 Is #PYTH in a buying position right now?
My assessment is that PYTH has bullish momentum, but the current price is not the most attractive place to enter without confirmation.
➡️ Pullback entry scenario:
Watch the approximate 0.081–0.082 zone. If price pulls back and forms a convincing bullish reversal with supportive volume, it could offer a more controlled entry than buying directly beneath resistance.
➡️ Breakout entry scenario:
Wait for a convincing 4-hour close above 0.08664 and watch whether the price can hold that level on a retest. A brief wick above resistance alone is not enough confirmation.
➡️ Bullish setup fails scenario:
If #Pyth price loses 0.0795 and cannot recover it, the current rebound may be weakening. A move toward the 0.0770 area becomes a possibility, with further downside risk if selling continues.
These levels are chart-based reference points, not predictions or guaranteed entry signals.
👉🏻 How you would approach a spot purchase?
* Avoid committing the entire intended amount at once after a sharp rally.
* Wait for either a supported pullback or a confirmed breakout and retest.
* Decide in advance where the setup would be considered invalid.
* Keep position size reasonable so that a failed trade does not cause an unnecessarily large loss.
* Remember that spot trading avoids liquidation from leverage, but the token can still fall significantly.
➡️ Final verdict: Wait for confirmation
➡️ Short-term momentum: Bullish
➡️ Immediate resistance: 0.0863–0.0867
➡️ First pullback area: 0.081–0.082
➡️ Main support reference: 0.0795
👉🏻 My decision is that I would not rush to buy at 0.08430 just because the price is green. I would prefer to see either a healthy pullback with buying support or a confirmed breakout above 0.08664 before considering an entry.
Disclaimer: This analysis is based on my personal research and observations and it isn’t any financial advice. Always do your own research before any investment.

