


🟡 Gold (XAU/USD) Market Analysis — 9 October 2026
Day-trading outlook | USD per troy ounce | Pakistan Standard Time
📊 1. Market overview
Gold is attempting to recover after its recent sell-off. A weaker US dollar may support prices, while US interest-rate expectations and Treasury yields remain important risks.
🟡 Overall bias: Short-term recovery, but reversal remains unconfirmed.
🟢 Bullish signal: Breakout above resistance with a successful retest.
🔴 Bearish signal: Rejection at resistance followed by a support breakdown.
Prices below are indicative reference levels from the earlier market snapshot, not verified live quotes.
🕯️Recent daily candlestick data
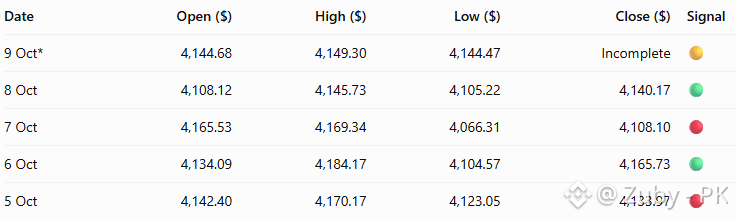
*Early-session snapshot; the 9 October daily candle is incomplete. Figures may vary by data provider.
🎯Key support and resistance
Price zoneSignificance$4,230–$4,231Major resistance$4,184–$4,200Strong resistance$4,165–$4,170Near-term resistance$4,140–$4,145Immediate price area$4,103–$4,110Support$4,066–$4,070Major support
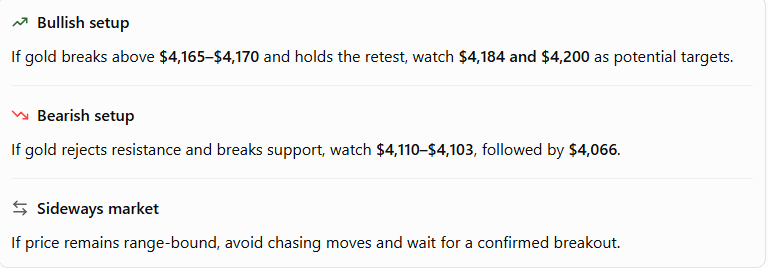
📈 Trading scenarios
⏱️ How to prepare for your next trade
🔎 Start with the 4-hour chart. Determine whether gold is making lower highs and lower lows or beginning to reverse them.
📊 Check the 1-hour chart. Mark the previous session's high and low, the current session's range, and the nearest support and resistance.
🕯️ Use the 15-minute chart for confirmation. Look for a breakout, rejection wick, engulfing candle, or successful retest at a marked level.
🎯 Refine the entry on the 5-minute chart. Enter only when the lower-timeframe setup agrees with your broader market assessment.
🛑 Set the stop-loss before entry. Place it beyond the structure that invalidates the setup, allowing for normal price fluctuations.
💰 Define your target and position size. Prefer setups offering at least 1:2 potential reward relative to risk, provided the target is technically realistic.
📰 Check the economic calendar. Watch for US inflation, employment, Federal Reserve commentary and other scheduled releases. Avoid opening a fresh position immediately before major news unless your strategy specifically accounts for event risk.
🧮 Position sizing and risk management
For a day trader, protecting capital matters more than catching every price move.
A simple position-sizing calculation is:

For example, suppose your account is $1,000 and you risk 0.5% on one trade.
Account risk budget: $5
Stop distance: $5 per ounce
At one ounce of exposure, a $5 adverse move costs $5, excluding fees and slippage.
Your broker's contract size and tick value determine the actual position size. A standard lot on one platform may not match another platform's gold contract.
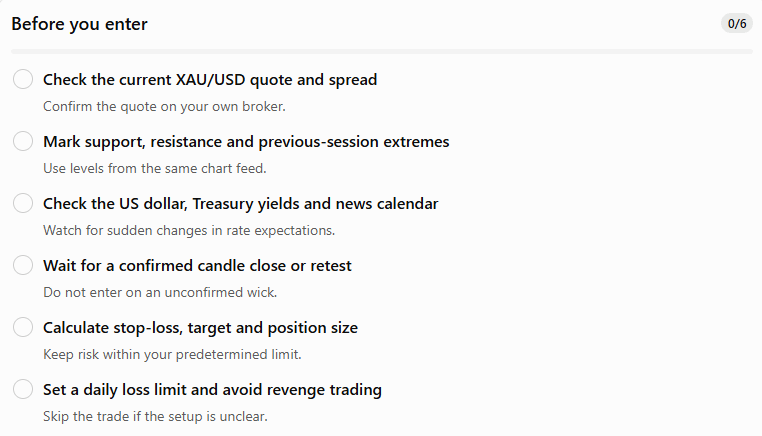
🗓️ Your pre-trade checklist
🔔 Final outlook for Friday, 9 October
🟡 Overall bias: Short-term recovery attempt within a market that still carries downside risk.
🟢 Buyers need to prove strength: Sustained movement above $4,165–$4,184 would improve the bullish case.
🔴 Sellers retain an opportunity: Rejection followed by a break of support could expose $4,110 and $4,066.
⚠️ Best trading decision: Wait for a confirmed setup rather than entering simply because gold is rising from its recent low.
The most important level to monitor is the $4,184 area for a stronger bullish reversal signal, while $4,066 remains a key downside reference in the published technical analysis. These levels should be reassessed against the live chart before trading.
📢 Disclaimer: This is educational market analysis, not financial advice. The levels are indicative and should be checked against your live broker chart before trading. ⚠️
#XAUUSDTechnicalAnalysis #GoldDayTradingStrategies #GoldBullishAndBearishScenarios