



Key Highlights
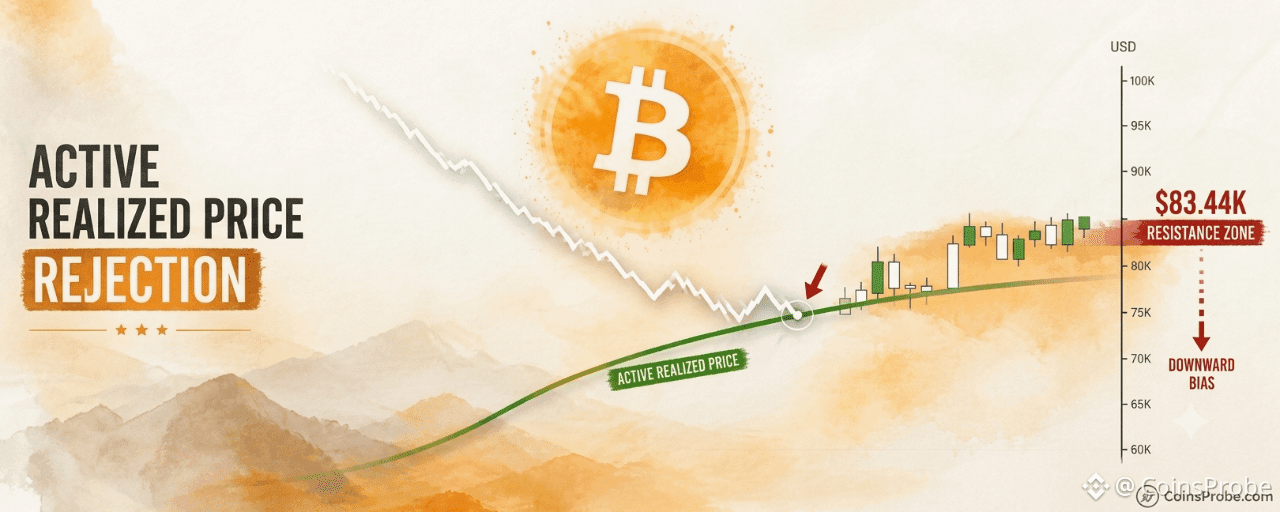
Bitcoin is trading at $82,762 (−1.66% in 24h), with a $1.66T market cap, after failing to hold above the Active Realized Price
Alphractal flags the Active Realized Price — a cost-basis metric excluding dormant/lost coins — acting as resistance, not support, a bearish structural signal
The Active Realized Price sits near $83.44K per chart annotation — a sustained close above it is required to restore bullish on-chain structure
Bitcoin is trading at $82,762 — down 1.66% in the past 24 hours, with a market cap of approximately $1.66 trillion. The decline is not just a price event. According to on-chain analytics platform Alphractal (@Alphractal), Bitcoin has failed to hold above its Active Realized Price — a refined cost-basis metric that strips out lost, deeply dormant, and permanently inactive coins. That failure carries specific structural implications that separate this moment from routine pullbacks.
Alphractal published the analysis on October 8, 2026, noting that Bitcoin “failed to hold above the Active Realized Price” — a level that, when acting as resistance rather than support, historically signals that the average active market participant is sitting at or above breakeven. That is a headwind, not a tailwind.
What the Active Realized Price Actually Measures
The traditional Realized Price — a widely cited on-chain metric — computes the average cost basis across all Bitcoin ever moved on-chain. It includes coins that have not moved in a decade, wallets that are likely lost forever, and supply held by long-term holders who are structurally insensitive to short-term price. This makes it a blunt instrument.
The Active Realized Price solves that problem. As Alphractal explains, it considers only coins classified as active supply — excluding lost, deeply dormant, and permanently inactive coins. By filtering the denominator to participants who are actually engaged with current market conditions, the Active Realized Price produces a cost-basis figure that more accurately reflects what today’s market participants paid for their Bitcoin. When price trades above it, active holders are in aggregate profit, reducing sell pressure. When price trades below it — or fails a retest of it — active holders are, on average, at or near breakeven or underwater. That shifts incentives toward distribution.
Chart 1 — Failed Breakout, Active Realized Price as Resistance
The first chart shared by Alphractal covers approximately January 2025 through October 2026. The white price line peaked mid-chart, declined sharply, then ranged sideways at lower levels before attempting a recovery. That recovery stalled. As the chart makes visually clear, Bitcoin’s price — marked at $83.44K in the chart annotation — failed to sustain a position above the Active Realized Price line. The level acted as resistance, not support. This is the structural read Alphractal is flagging: the metric that should be a floor is instead functioning as a ceiling. The chart also displays a reference level at $346,827 (top right label), which appears as a longer-term model coordinate on the same chart frame, and axis boundaries of $100K and $10K as display bounds.
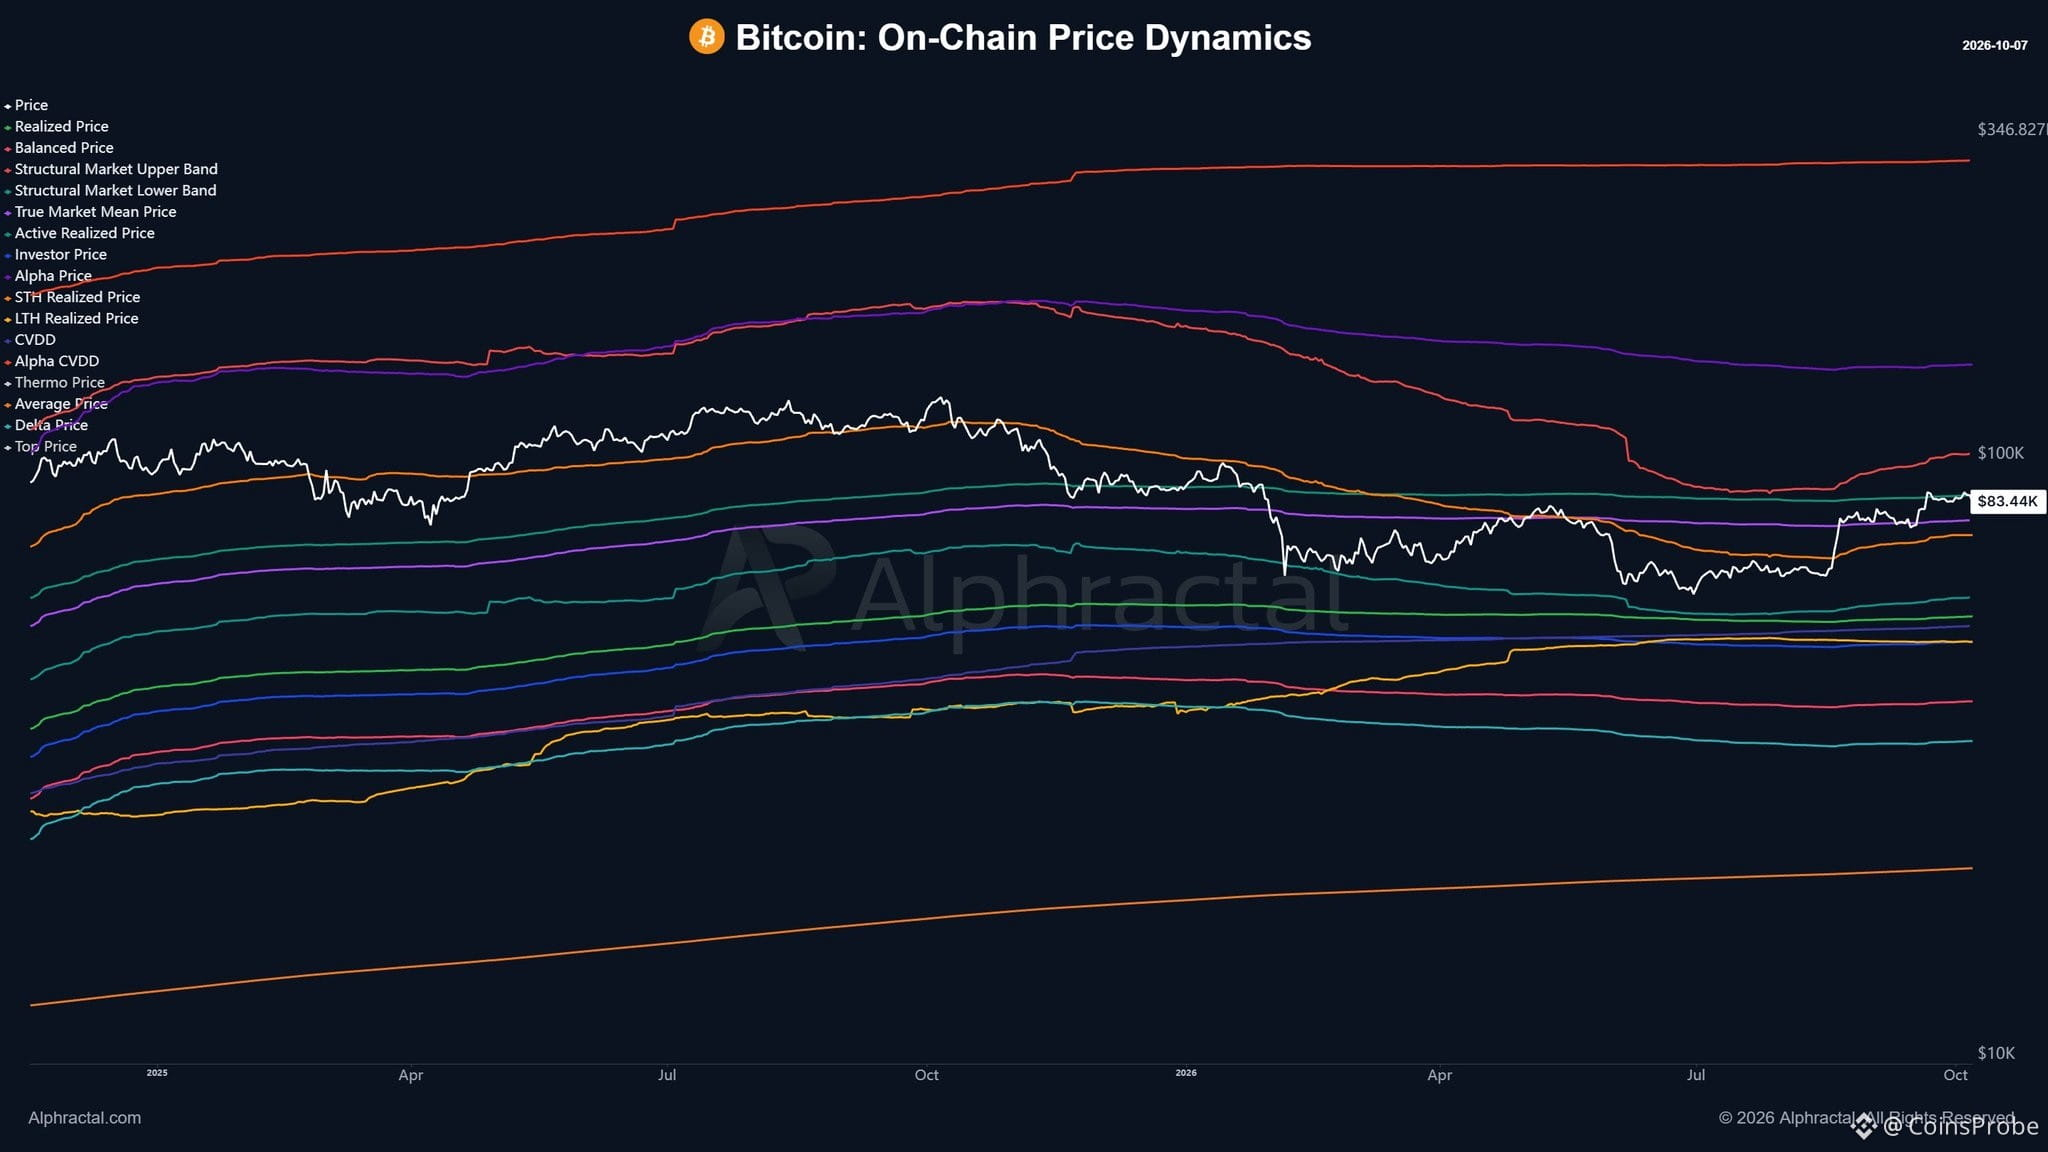
Chart 1 of 2: Chart Analysis | Source: @Alphractal (X)
Chart 2 — Active Realized Price Convergence Since 2023
The second chart extends the view back to early 2023, capturing Bitcoin’s full cycle from the post-FTX lows through the 2024 bull run and subsequent consolidation. The green line — the Active Realized Price — curves steadily upward throughout, reflecting the rising cost basis of active market participants as new buyers entered at progressively higher prices during 2024. Bitcoin’s white price line rose sharply through 2024, peaked in late 2024 and early 2025, then declined and consolidated. The most recent candles in the chart sit near or slightly above the green line, at a chart-annotated price of $83.44K, with axis references at $139.69K (top right), $100K, and $20.131K (bottom right). The convergence of price toward the Active Realized Price line is the critical development — Alphractal’s signal is precisely that Bitcoin failed to hold above it, confirming the level has shifted from support to resistance in this timeframe.
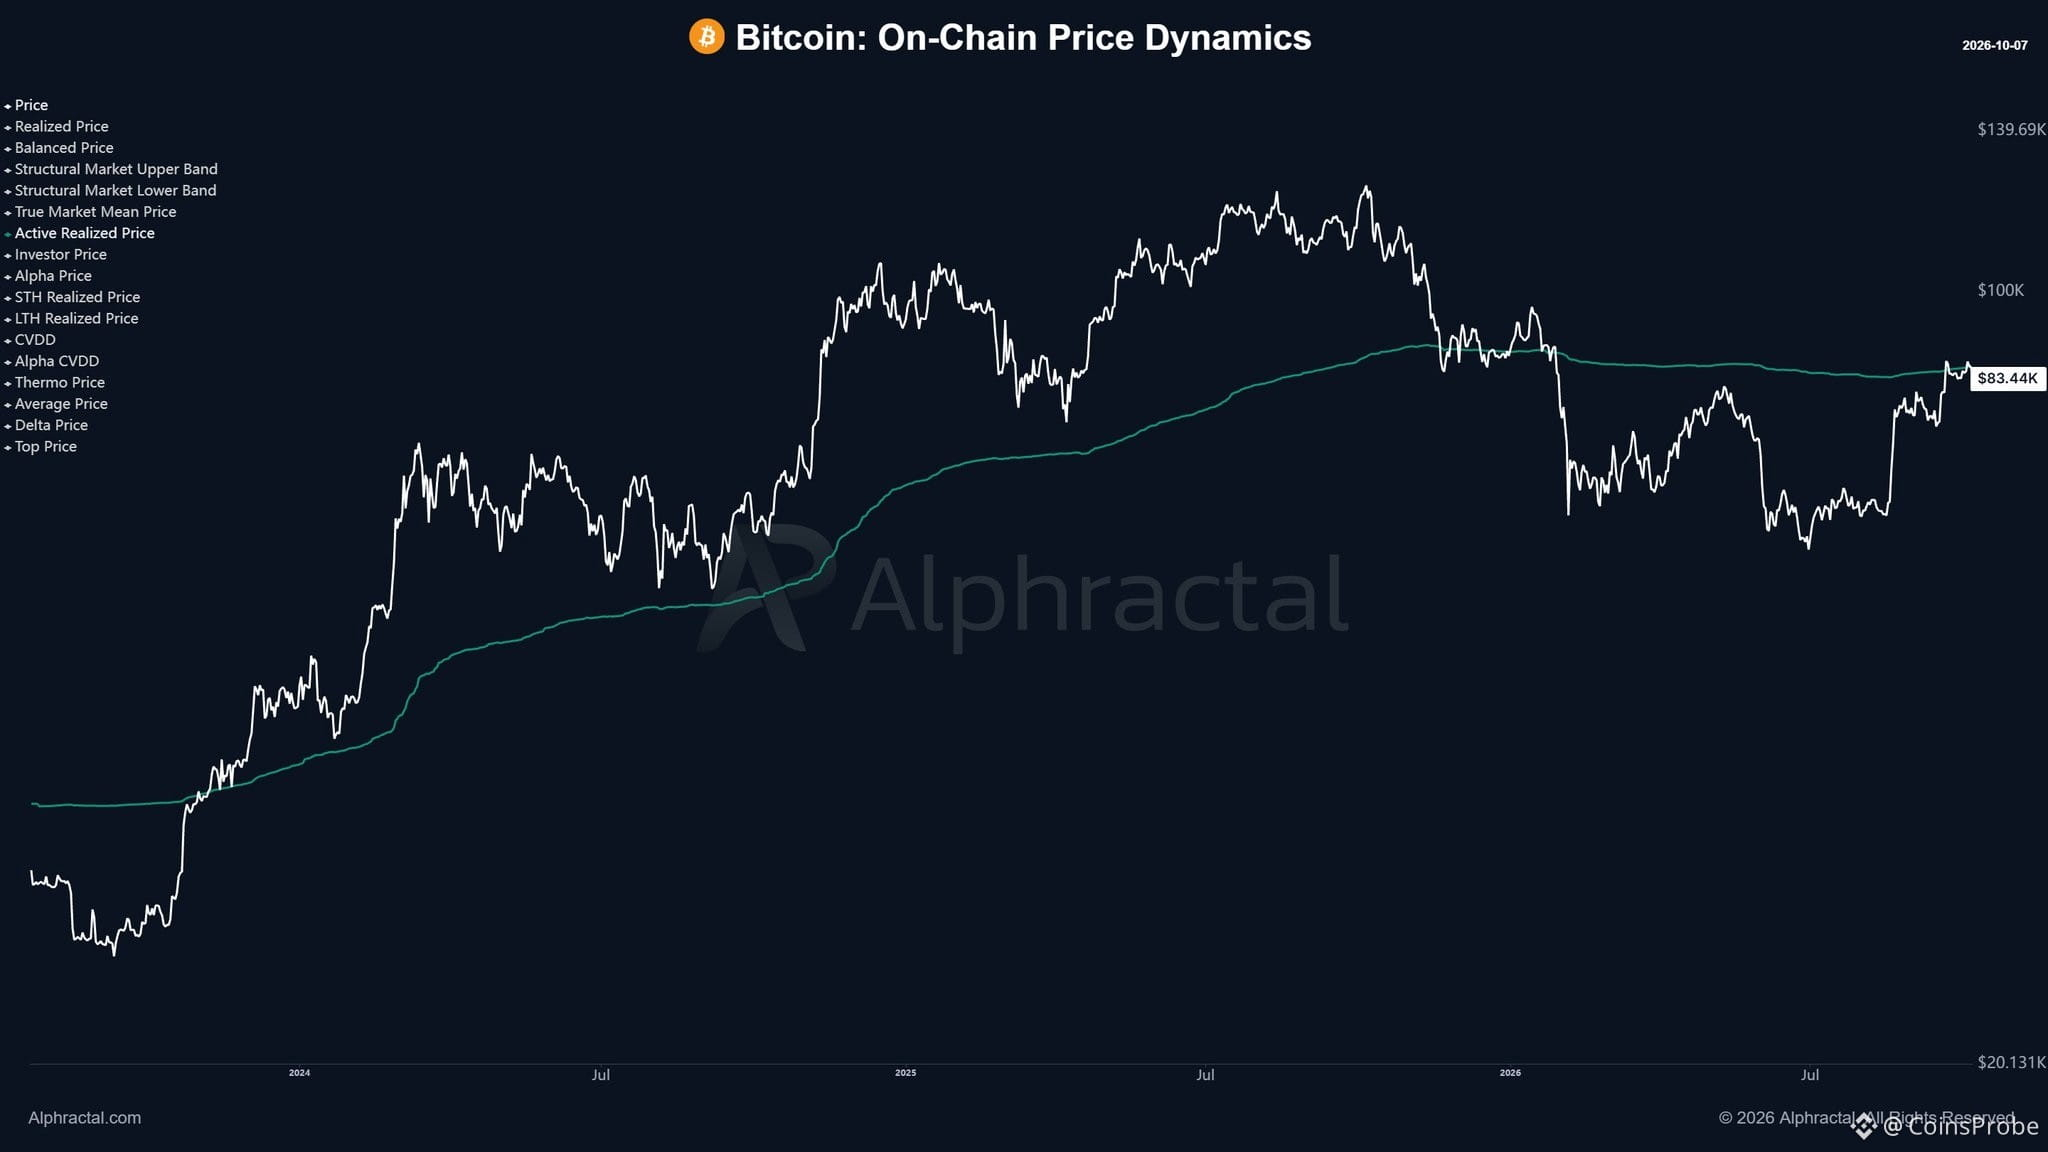
Source: @Alphractal (X)
Why This Is Structurally Different From a Standard Pullback
Most pullbacks in an ongoing bull market see Bitcoin dip toward — but not decisively break below — its cost-basis metrics. The Active Realized Price failing as a retest level is a more bearish configuration than simply trading below it for the first time. A failed retest means price attempted to reclaim the metric, found sellers there, and was rejected. That sequence establishes the line as overhead resistance for the next attempted move up.
The practical implication: active participants who bought during the 2024 run-up — and who form the most liquid, price-sensitive cohort of the market — are on average at or above current prices. That supply overhang does not resolve quickly. It resolves either through time (as holders capitulate or the market absorbs selling) or through a decisive move that pushes price back above the Active Realized Price with enough momentum to convert resistance to support. Neither has happened yet. This dynamic is part of a broader context of Bitcoin’s recent volatility — as noted in Bitcoin’s sharp $2,000 drop that liquidated $400M in longs — and connects to the exchange flow picture documented in Bitcoin’s deeply negative 30-day exchange netflow.
The Level That Decides the Near-Term Thesis
The Active Realized Price, as annotated in Alphractal’s charts, corresponds to approximately the current trading range near $83.44K (chart-annotated value) versus Bitcoin’s live price of $82,762 at time of writing. The gap between where the metric sits and where Bitcoin is currently trading is narrow — but direction matters more than distance here.
A sustained close above the Active Realized Price would flip the structural read: active holders would move back into aggregate profit, removing the overhead supply dynamic and restoring the metric to its intended role as on-chain support. A continued failure — especially if Bitcoin moves further below the line — would deepen the bearish structure and increase the probability of further distribution from active supply. For broader context on where professional on-chain analysts currently sit, the CryptoQuant analyst consensus puts BTC at 82.5% bullish — a reading that now faces its own test given the Active Realized Price failure.
Bullish Scenario
Bitcoin reclaims and sustains a position above the Active Realized Price (approximately $83.44K per the chart annotation). That reclaim would shift active holders back into aggregate profit, converting the metric from resistance to support and removing the supply overhang that the current failed retest has created. A confirmed reclaim reopens the path toward the $100K axis range visible in both of Alphractal’s charts.
Bearish Scenario
Bitcoin continues to trade below the Active Realized Price without a meaningful retest attempt. That sustained failure deepens the structural headwind — active holders remain underwater or at breakeven on aggregate, incentivizing distribution. The bearish case accelerates if the Active Realized Price green line, which has been curving steadily upward since 2023, begins to catch down to current prices rather than price recovering up to it.
The Active Realized Price is not a sentiment indicator, a derivatives metric, or a price prediction. It is a cost-basis calculation for the segment of Bitcoin supply that is actively participating in markets today. Bitcoin’s failure to hold above it — flagged by Alphractal on October 8, 2026 — means the average active participant is at or above breakeven at current prices. That is the supply dynamic the market must resolve.
Watch the $83.44K Active Realized Price level: a sustained close above it confirms the failed retest was a temporary rejection and restores bullish on-chain structure; continued rejection below it keeps the overhead supply dynamic intact and signals the deeper consolidation is not yet finished.
Disclaimer: The views and analysis presented in this article are for informational purposes only and reflect the author’s perspective, not financial advice. Technical patterns and indicators discussed are subject to market volatility and may or may not yield anticipated results. Investors are advised to exercise caution, conduct independent research, and make decisions aligned with their individual risk tolerance.