Bearish stack on ZEC hints at a short-term pullback.
🔴 SHORT $ZEC /USDT: expecting price to go DOWN
Bias: SHORT · Leaning
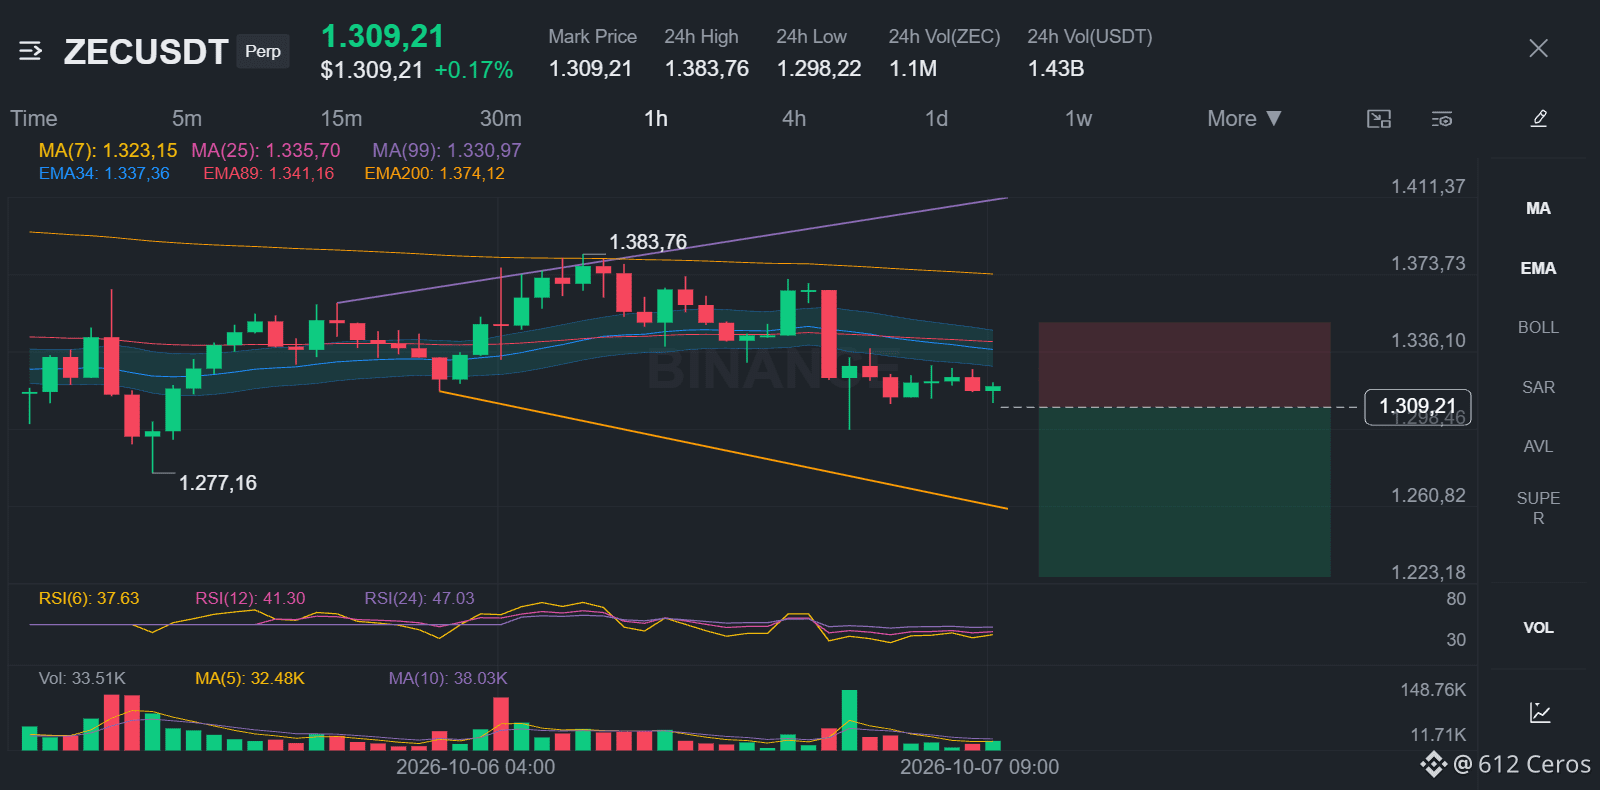
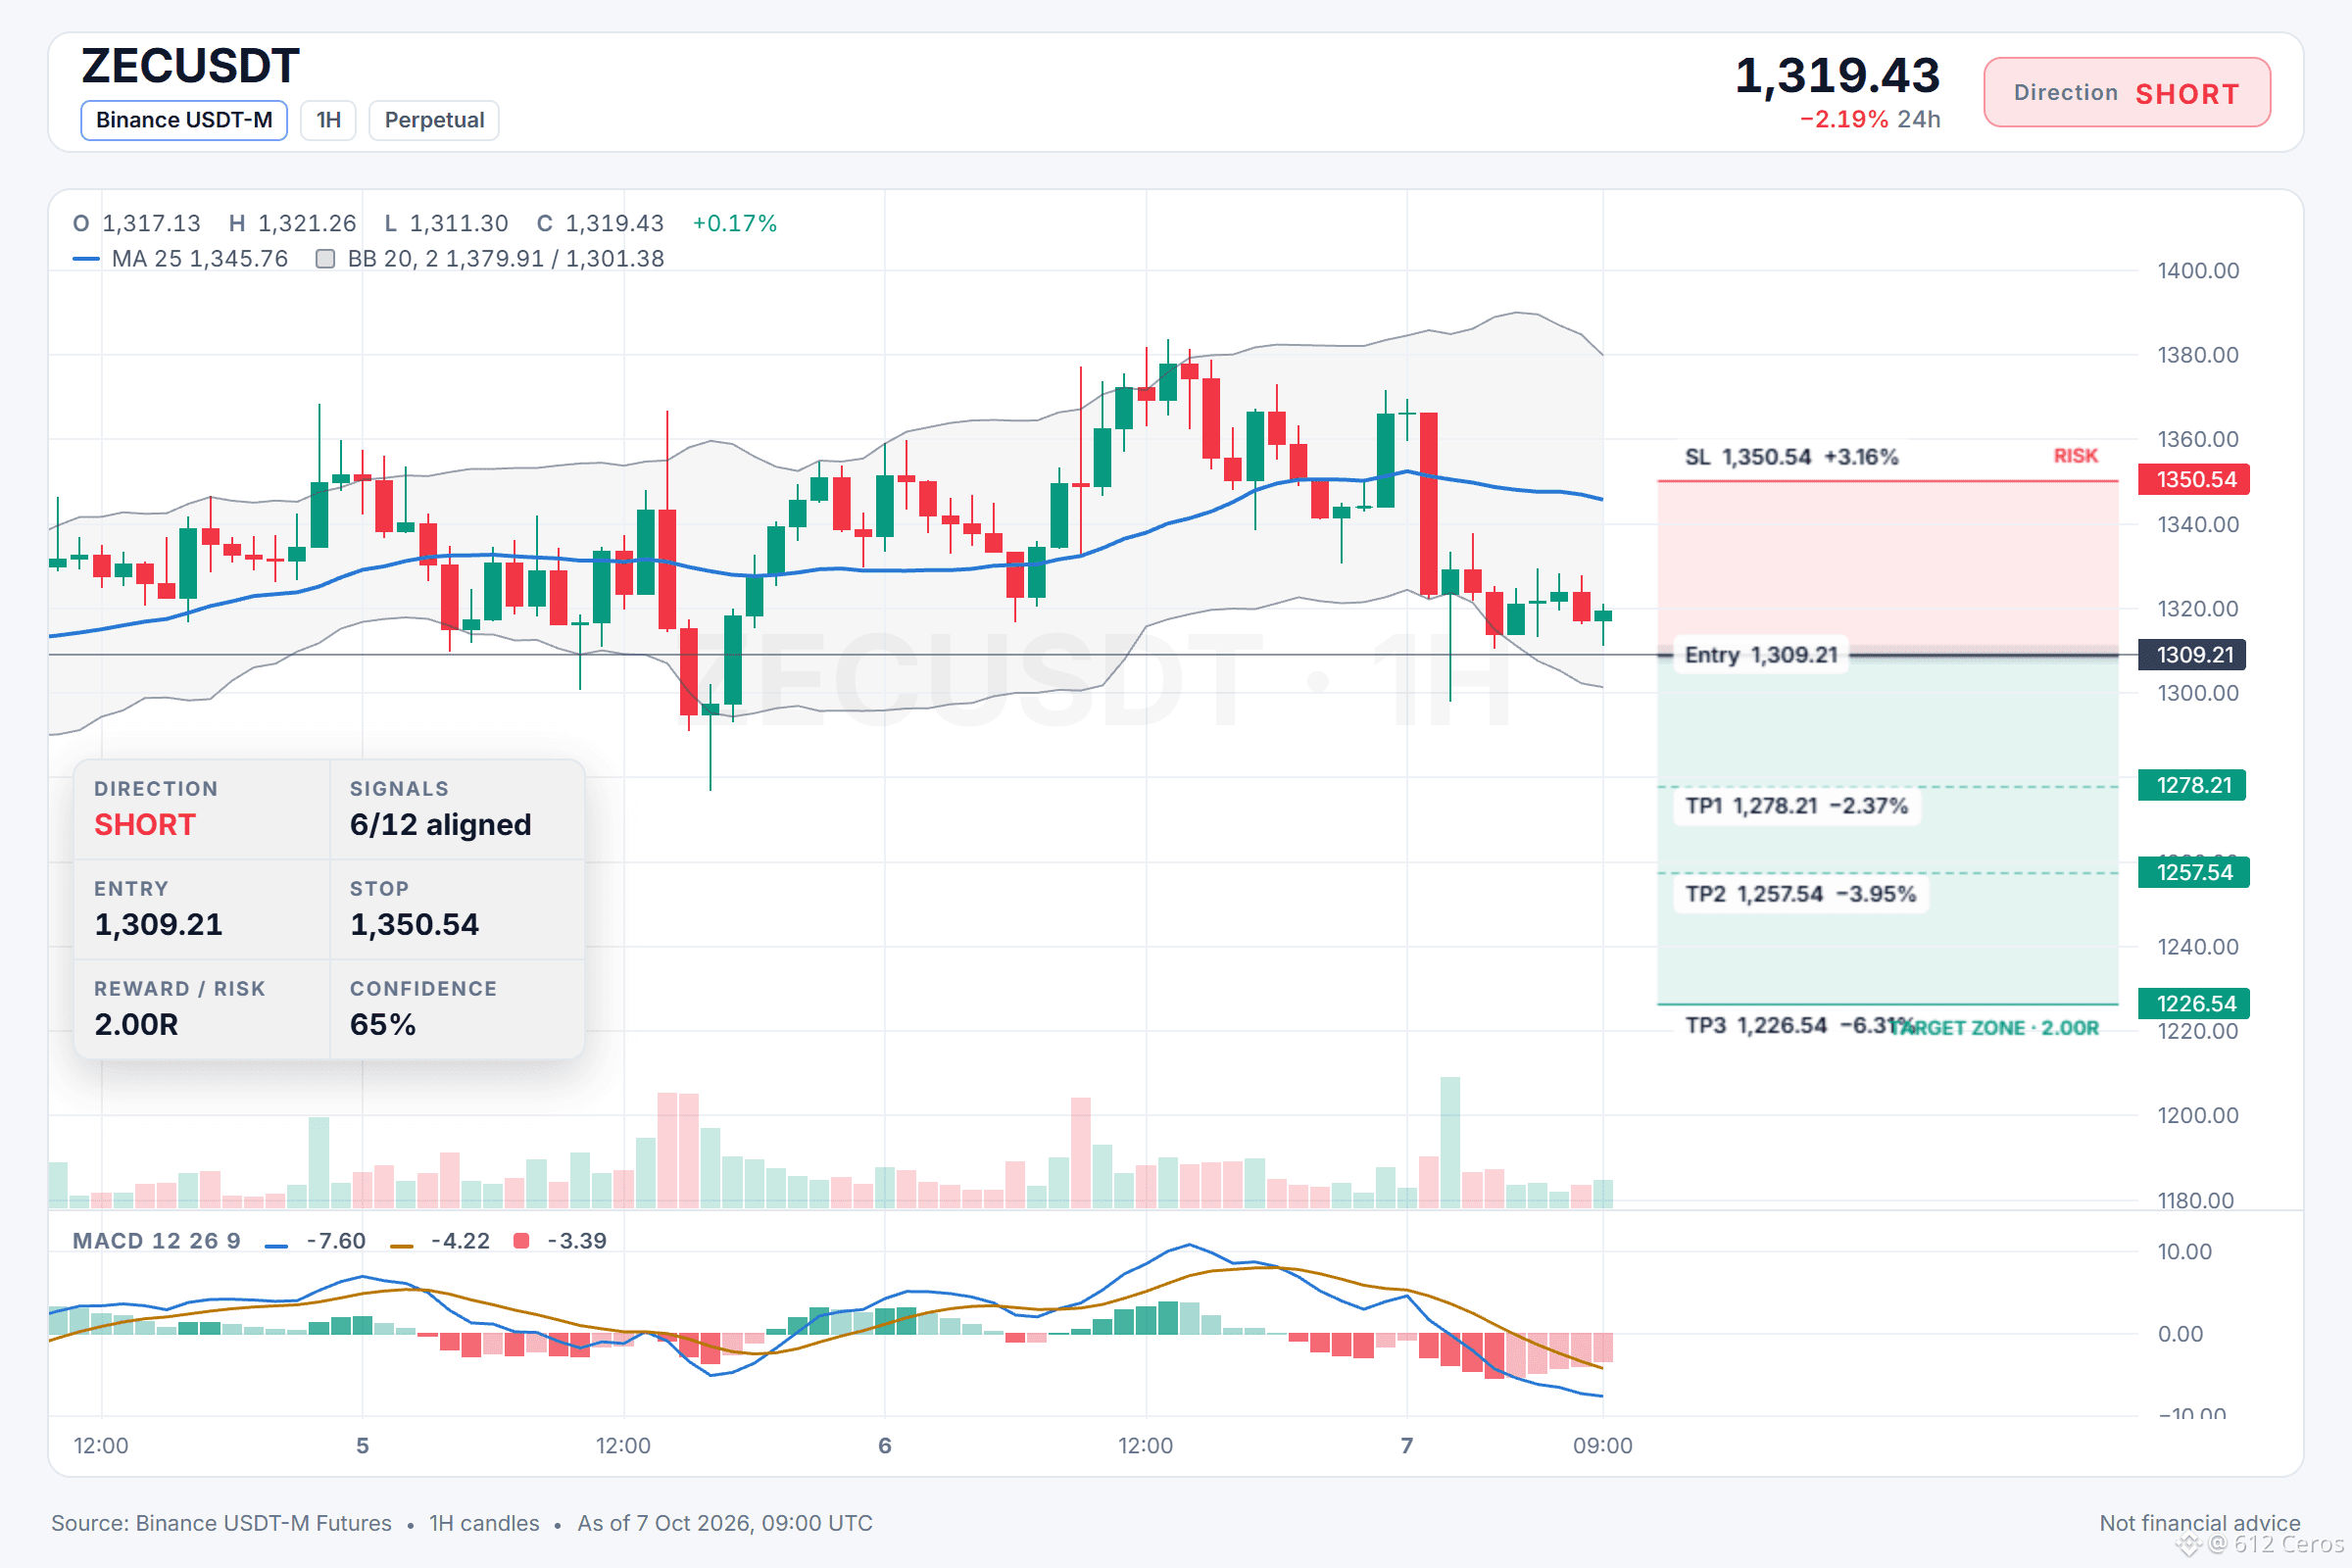
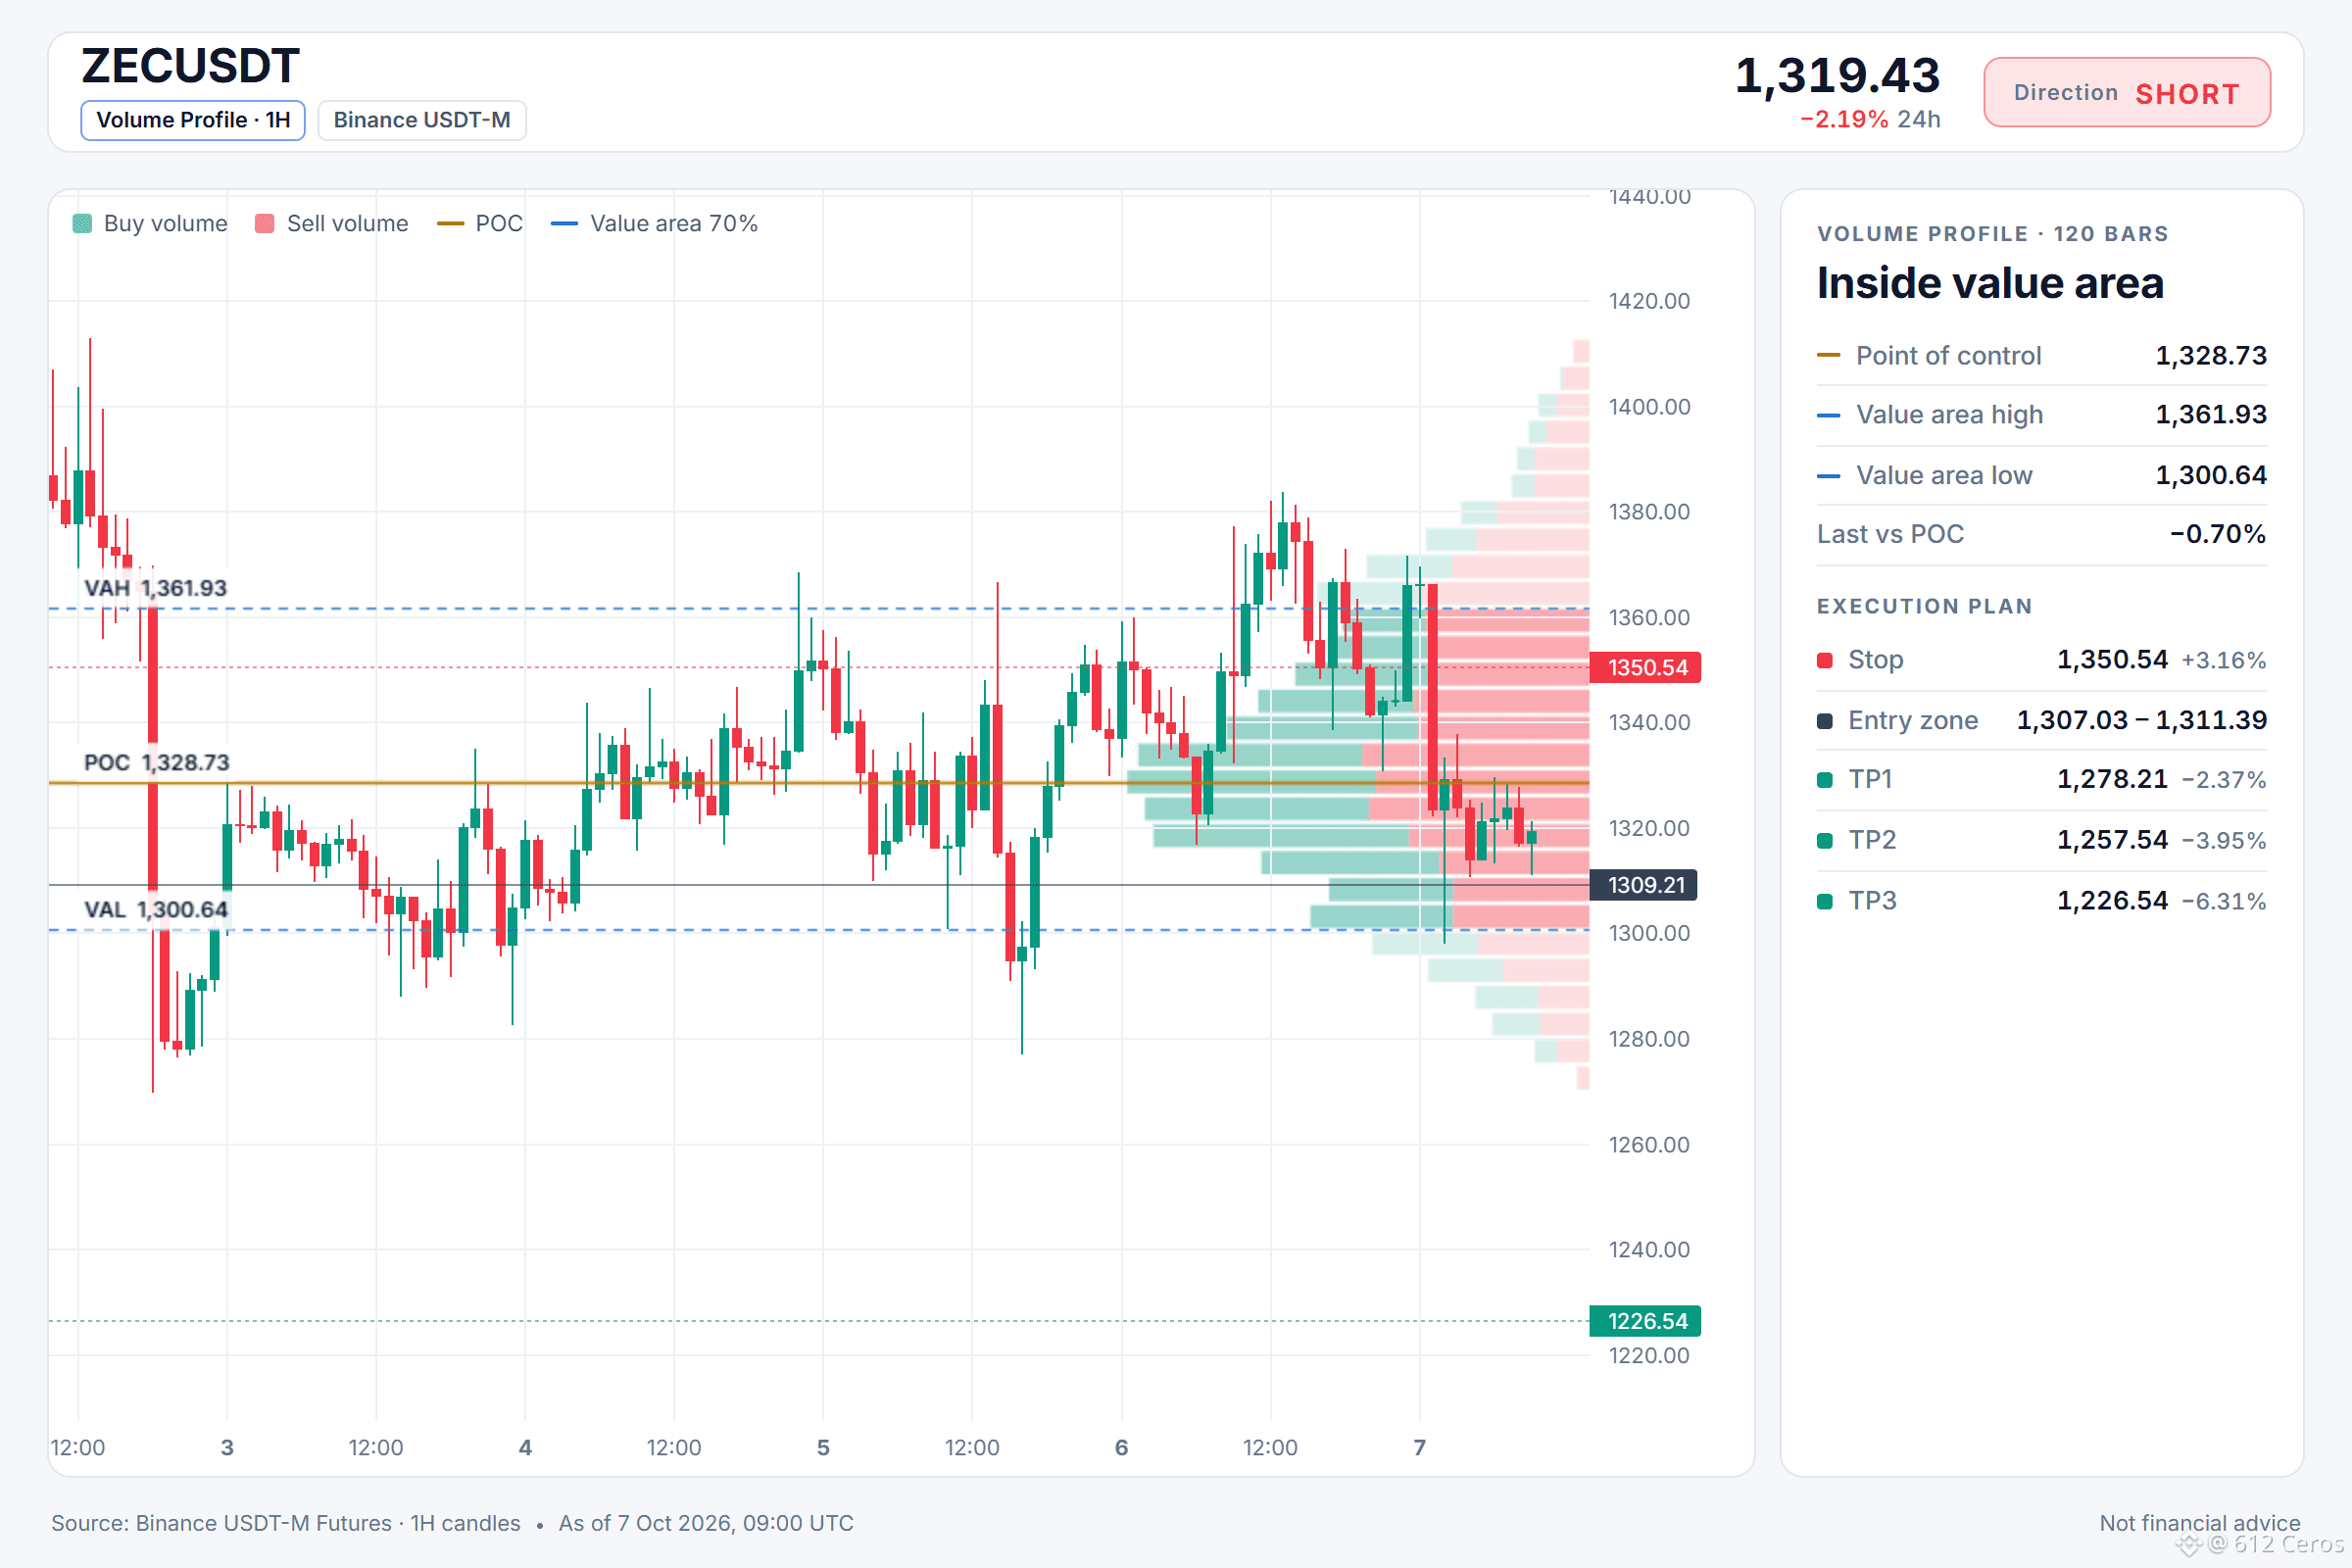
Entry: 1307.03 – 1311.39
TP1: 1278.21 (-2.4%)
TP2: 1257.54 (-3.9%)
TP3: 1226.54 (-6.3%)
SL: 1350.54 (+3.2%)
Plan: enter only inside the zone, take half at TP1, then move the stop to entry.
Caution: counter-trend setup against the bigger trend, only 6 signals confirm it. Size down, respect the stop.
Why SHORT? Leaning call, 6/12 signals agree, 1 against, 5 undecided.
• 1h trend: price < EMA50 < EMA200, bearish stack → the short-term trend is down
• Trend strength (ADX/DI, 15m): ADX 24.2 with sellers in control (DI+ 10.4 vs DI− 26.3) → sellers are driving the move
• BTC backdrop: BTC trend is bearish and correlation is 0.73 → BTC is falling and this coin tends to follow
Risk: Daily trend: price > EMA50 > EMA200, bullish stack → the big-picture trend is up
ZEC in 3 points:
1/3 The 1h trend is down, price below EMA50 and EMA200.
2/3 RSI at 41.9 and 15m RSI z-score minus 1.23 show sellers are driving momentum.
3/3 The daily trend is bullish, so this is a counter-trend bet that can reverse quickly.
What level would make you stay flat on ZEC instead of entering?
Levels mapped on the chart below.
📲 Want more of my latest signals? Join me here:
https://app.binance.com/uni-qr/D26WbL9t
⚠️ Personal market analysis only. NFA — manage risk and DYOR.
Educational content, not investment advice or a recommendation to buy, sell, deposit, or withdraw any asset. No paid promotion or referral/affiliate links.
🔴 SHORT $ZEC /USDT: expecting price to go DOWN
Bias: SHORT · Leaning
Entry: 1307.03 – 1311.39
TP1: 1278.21 (-2.4%)
TP2: 1257.54 (-3.9%)
TP3: 1226.54 (-6.3%)
SL: 1350.54 (+3.2%)
Plan: enter only inside the zone, take half at TP1, then move the stop to entry.
Caution: counter-trend setup against the bigger trend, only 6 signals confirm it. Size down, respect the stop.
Why SHORT? Leaning call, 6/12 signals agree, 1 against, 5 undecided.
• 1h trend: price < EMA50 < EMA200, bearish stack → the short-term trend is down
• Trend strength (ADX/DI, 15m): ADX 24.2 with sellers in control (DI+ 10.4 vs DI− 26.3) → sellers are driving the move
• BTC backdrop: BTC trend is bearish and correlation is 0.73 → BTC is falling and this coin tends to follow
Risk: Daily trend: price > EMA50 > EMA200, bullish stack → the big-picture trend is up
ZEC in 3 points:
1/3 The 1h trend is down, price below EMA50 and EMA200.
2/3 RSI at 41.9 and 15m RSI z-score minus 1.23 show sellers are driving momentum.
3/3 The daily trend is bullish, so this is a counter-trend bet that can reverse quickly.
What level would make you stay flat on ZEC instead of entering?
Levels mapped on the chart below.
📲 Want more of my latest signals? Join me here:
https://app.binance.com/uni-qr/D26WbL9t
⚠️ Personal market analysis only. NFA — manage risk and DYOR.
Educational content, not investment advice or a recommendation to buy, sell, deposit, or withdraw any asset. No paid promotion or referral/affiliate links.