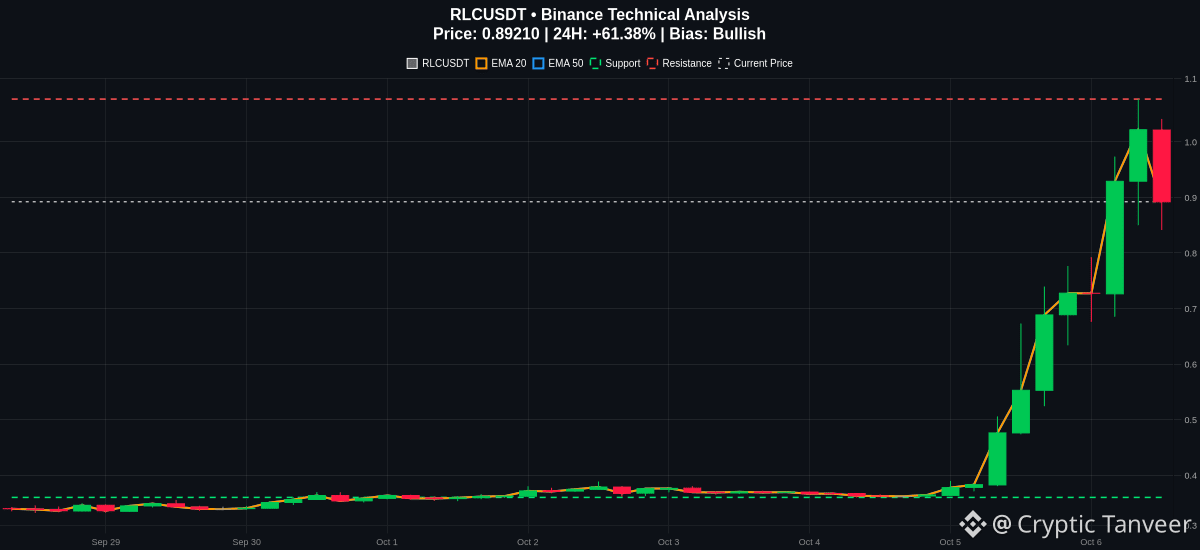
What happens when a coin surges over 61 percent in a single day and stares right at a major barrier? RLCUSDT is testing the market's limits right now.
Trading at 0.8921, the price is rapidly approaching the key resistance level at 1.077. The overall trend structure remains clearly bullish, supported by moving averages where the EMA20 sits at 0.599 and the EMA50 sits at 0.471.
Momentum indicators show strong upside pressure. The MACD is at 0.138 above its signal line of 0.079, reflecting active buying momentum. However, the RSI is currently reading 78.37, which indicates elevated and overbought conditions. While this highlights strong bullish momentum, it also introduces potential pullback risk given how far the price is currently extended above the EMA20.
Traders should watch for a sustained move toward 1.077 if momentum holds. A realistic invalidation or risk level sits back near the support at 0.36 should the market reverse. Remember that technical setups can fail, and managing risk is essential.
Are you expecting a clean break above resistance or a sharp retest of the moving averages first?
#RLC #CryptoTrading #TechnicalAnalysis
Trading at 0.8921, the price is rapidly approaching the key resistance level at 1.077. The overall trend structure remains clearly bullish, supported by moving averages where the EMA20 sits at 0.599 and the EMA50 sits at 0.471.
Momentum indicators show strong upside pressure. The MACD is at 0.138 above its signal line of 0.079, reflecting active buying momentum. However, the RSI is currently reading 78.37, which indicates elevated and overbought conditions. While this highlights strong bullish momentum, it also introduces potential pullback risk given how far the price is currently extended above the EMA20.
Traders should watch for a sustained move toward 1.077 if momentum holds. A realistic invalidation or risk level sits back near the support at 0.36 should the market reverse. Remember that technical setups can fail, and managing risk is essential.
Are you expecting a clean break above resistance or a sharp retest of the moving averages first?
#RLC #CryptoTrading #TechnicalAnalysis