


A practical guide to recognizing, confirming, and understanding chart patterns.
Learning Chart Patterns on the Chart
If you have ever opened someone else's breakdown, you have probably seen flags, triangles, head and shoulders, and more.
A beginner may think experienced traders know some secret.
No.
They recognize repeating shapes and understand what those shapes can tell us about market behaviour.
In this guide, we'll break down five useful chart patterns, how to confirm them, and where beginners commonly get them wrong.
 THEORY
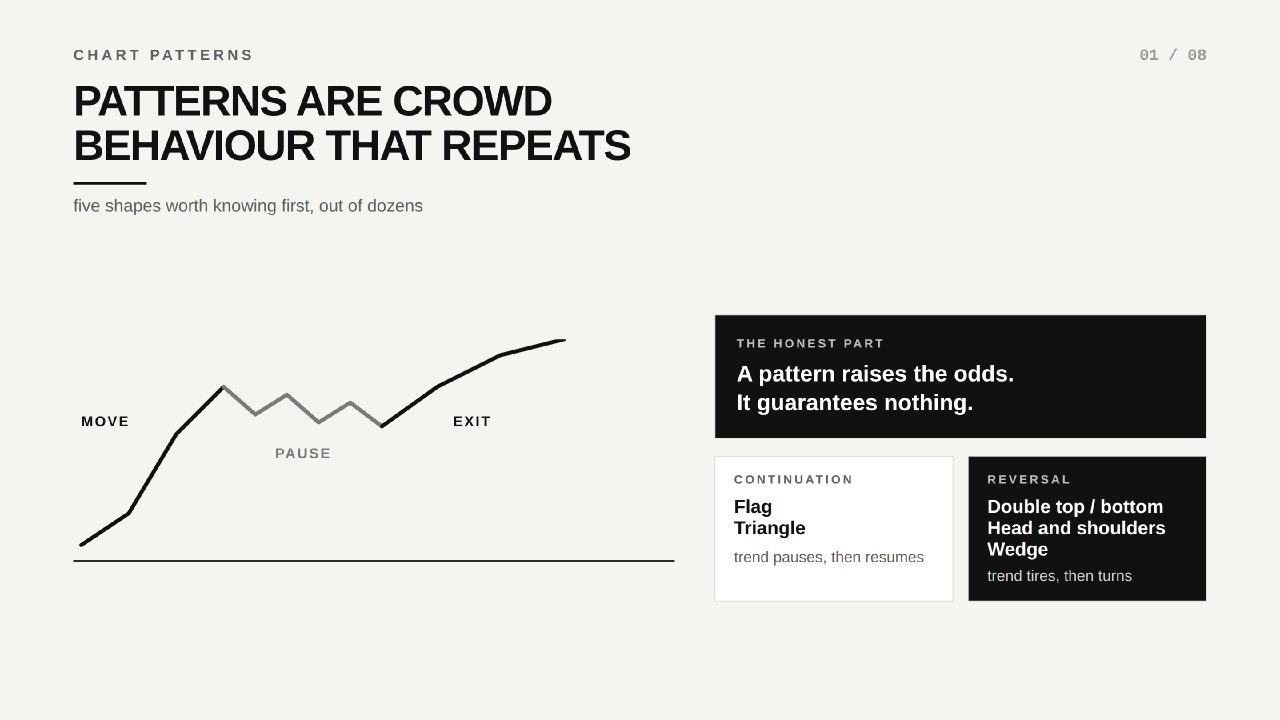
A pattern is a repeating form of crowd behaviour on the chart.
Most patterns can be understood through:
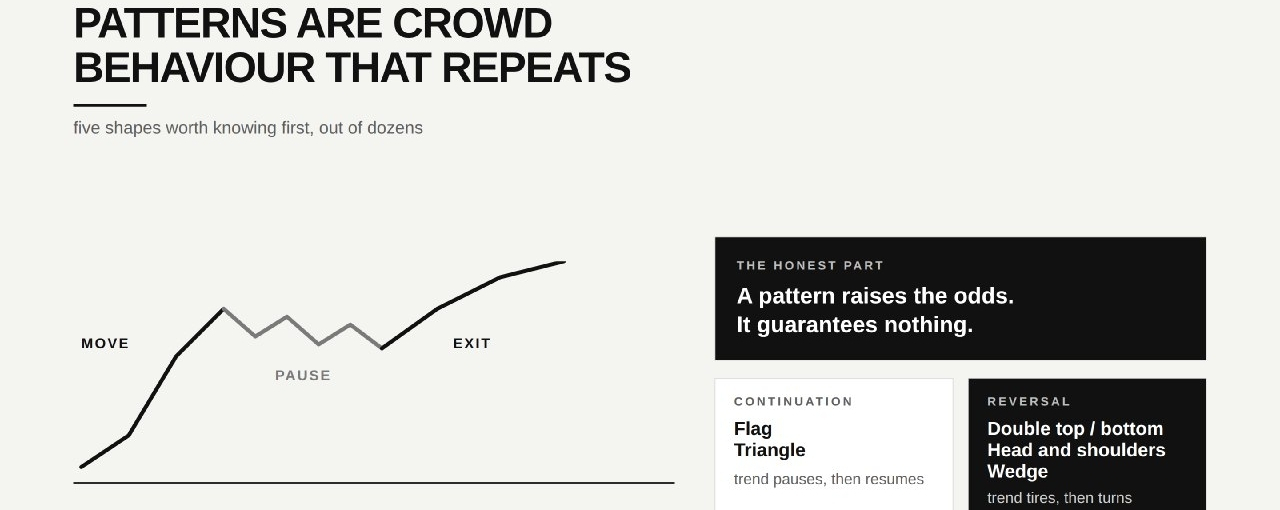
A MOVE → A PAUSE → A BREAKOUT
During the pause, buyers and sellers fight over price. The resulting shape can hint at which side is gaining strength.
A pattern raises the odds. It guarantees nothing.
The two main categories are:
Continuation Patterns
The current trend pauses and may continue.
Reversal Patterns
The existing trend loses momentum and may reverse.
THE FLAG
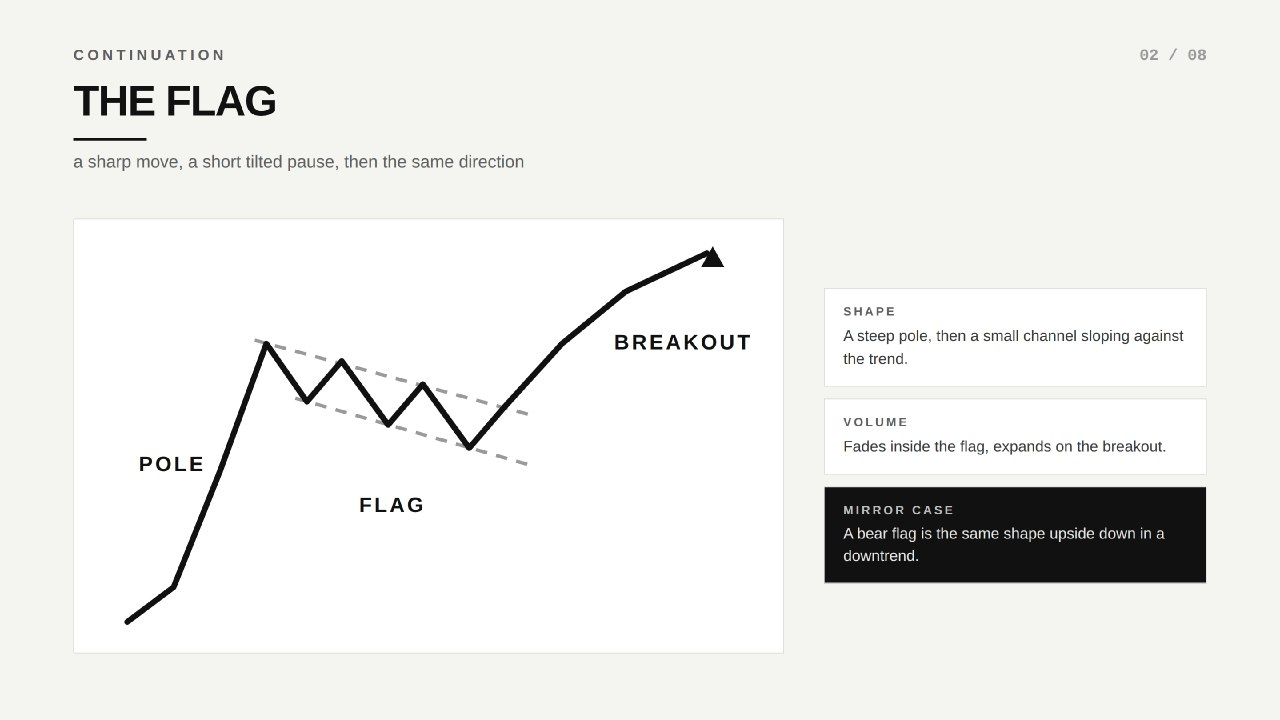
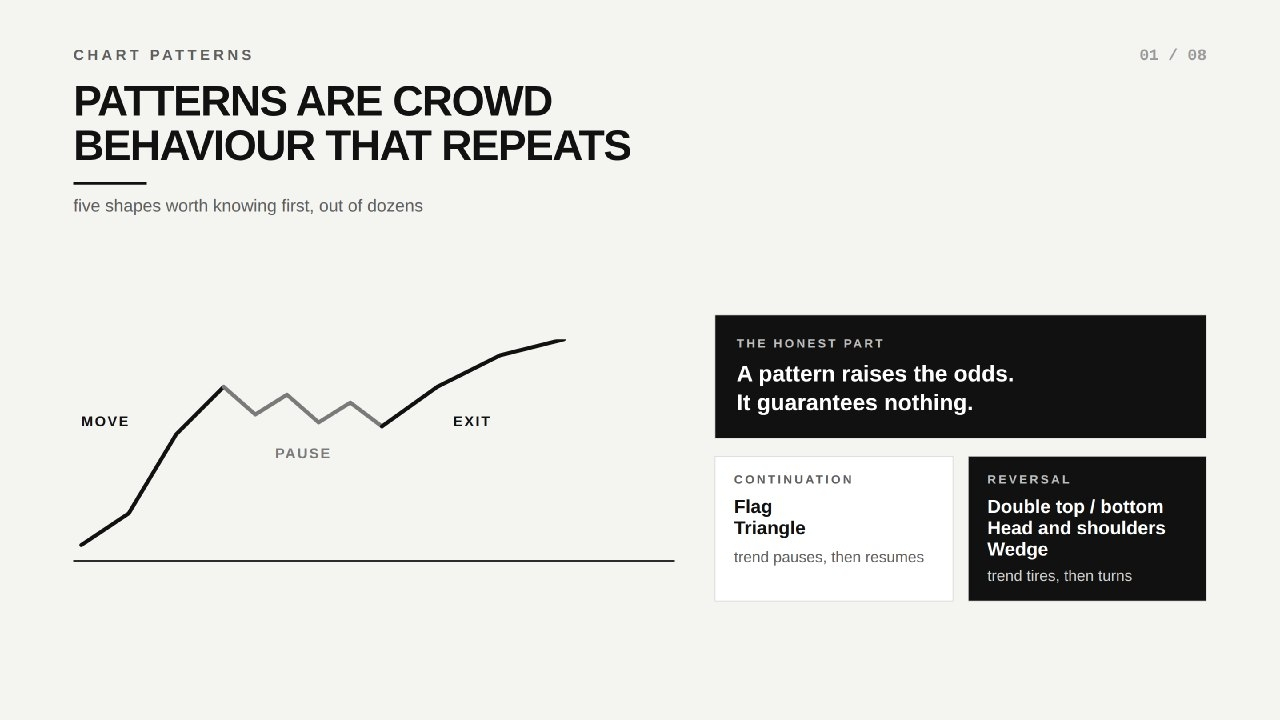
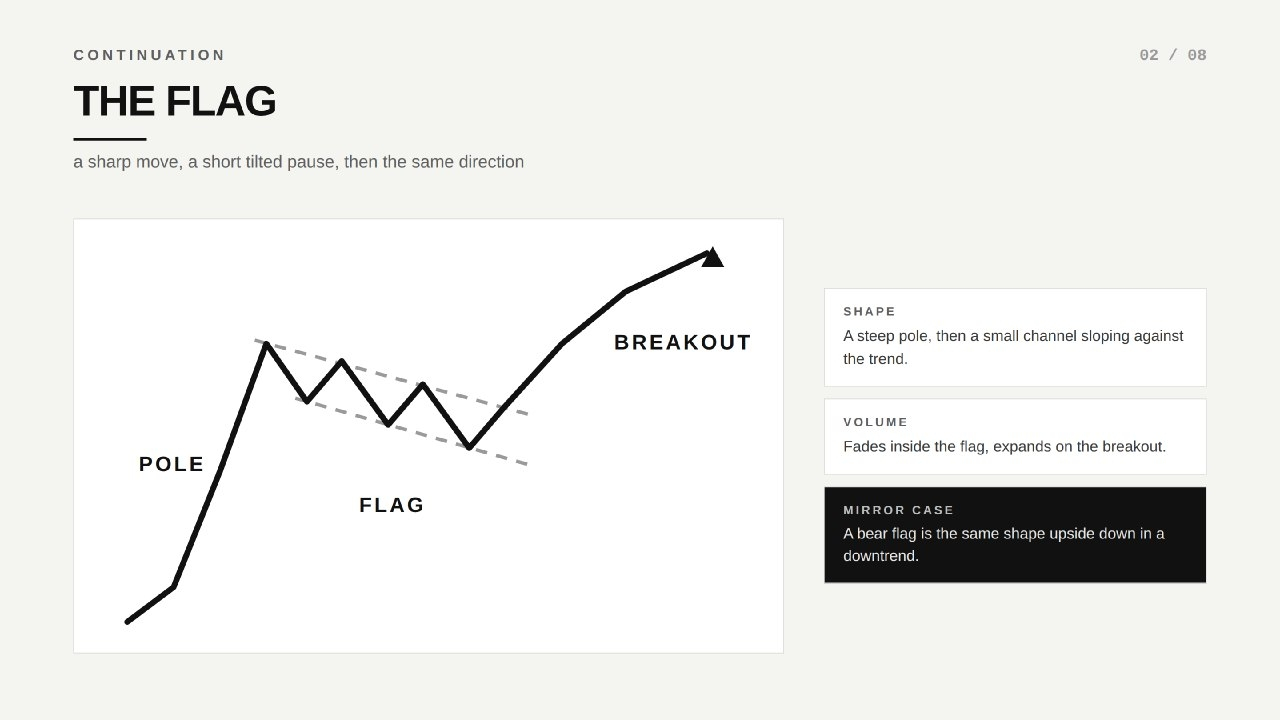
A flag starts with a sharp move known as the flagpole, followed by a short consolidation forming a small channel against the original trend.
After the pause, price may break out and continue in the original direction.
After a strong impulse, some traders take profits and price pulls back, but sellers may not have enough strength to reverse the market.
Volume inside the flag usually fades, while breakout volume can expand.
A bearish flag is the same structure in reverse: sharp drop → upward-sloping channel → potential continuation lower.
THE TRIANGLE
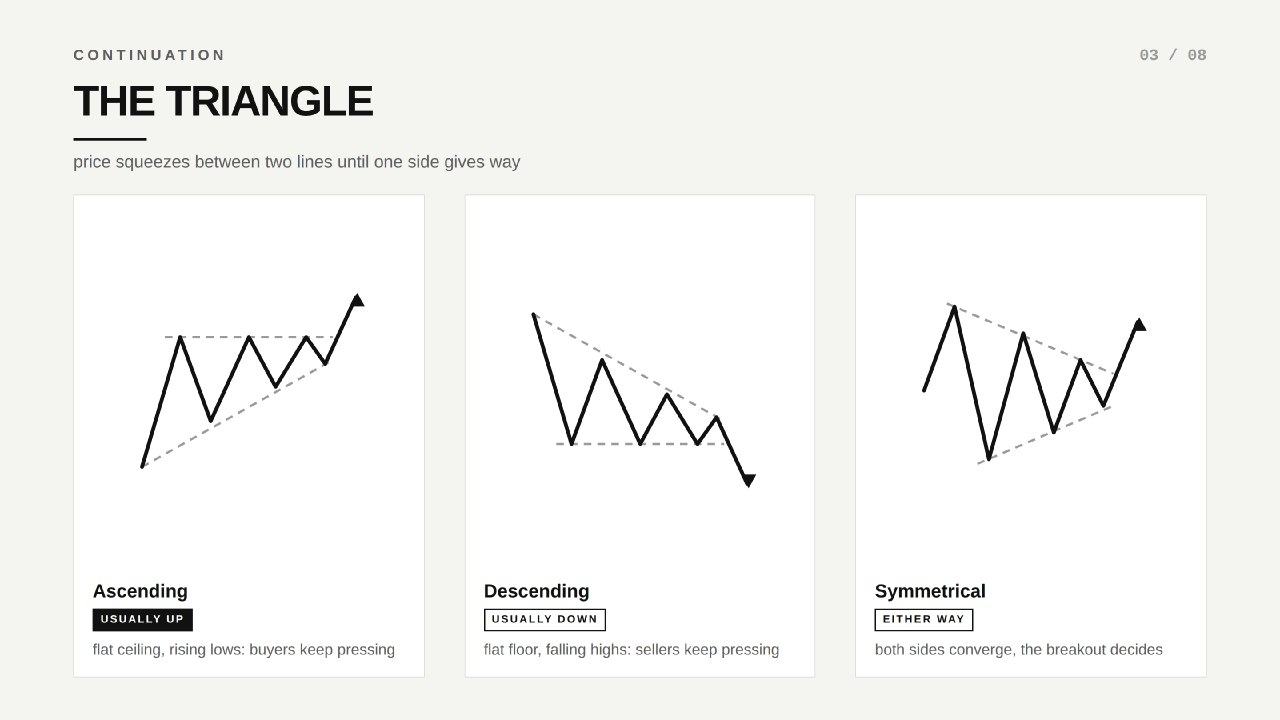
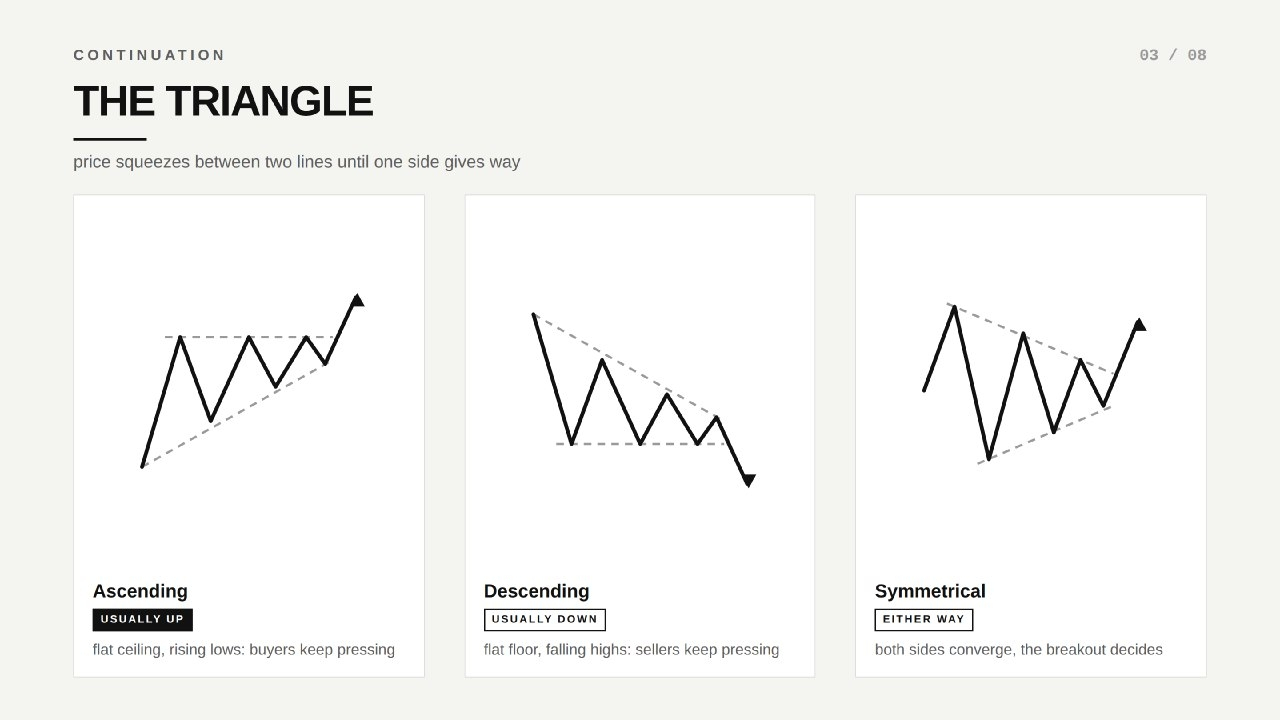
A triangle forms when price gets squeezed between two converging lines.
Ascending Triangle
Flat resistance + rising lows. Buyers repeatedly test the same level.
Descending Triangle
Flat support + falling highs. Sellers repeatedly pressure the same floor.
Symmetrical Triangle
Both trendlines converge, leaving the breakout direction to decide the next move.
Volume often decreases inside the triangle and increases when price breaks out.
DOUBLE TOP & DOUBLE BOTTOM
The idea is simple:
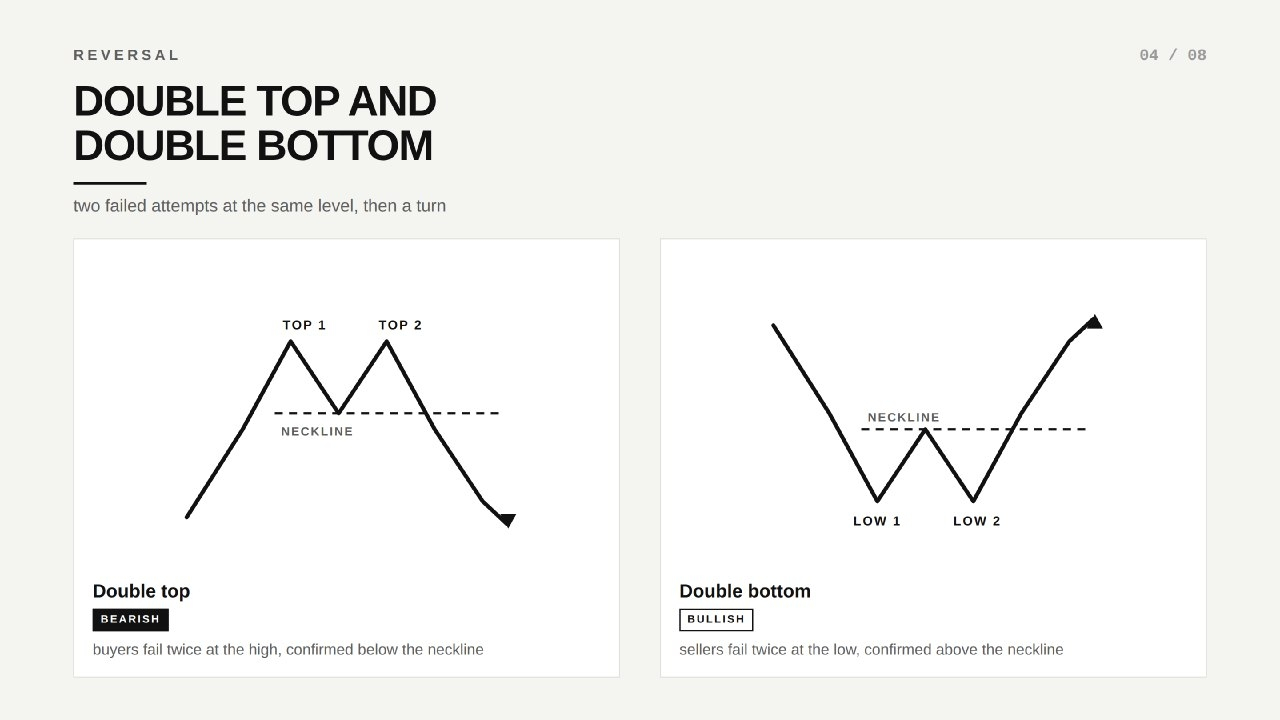
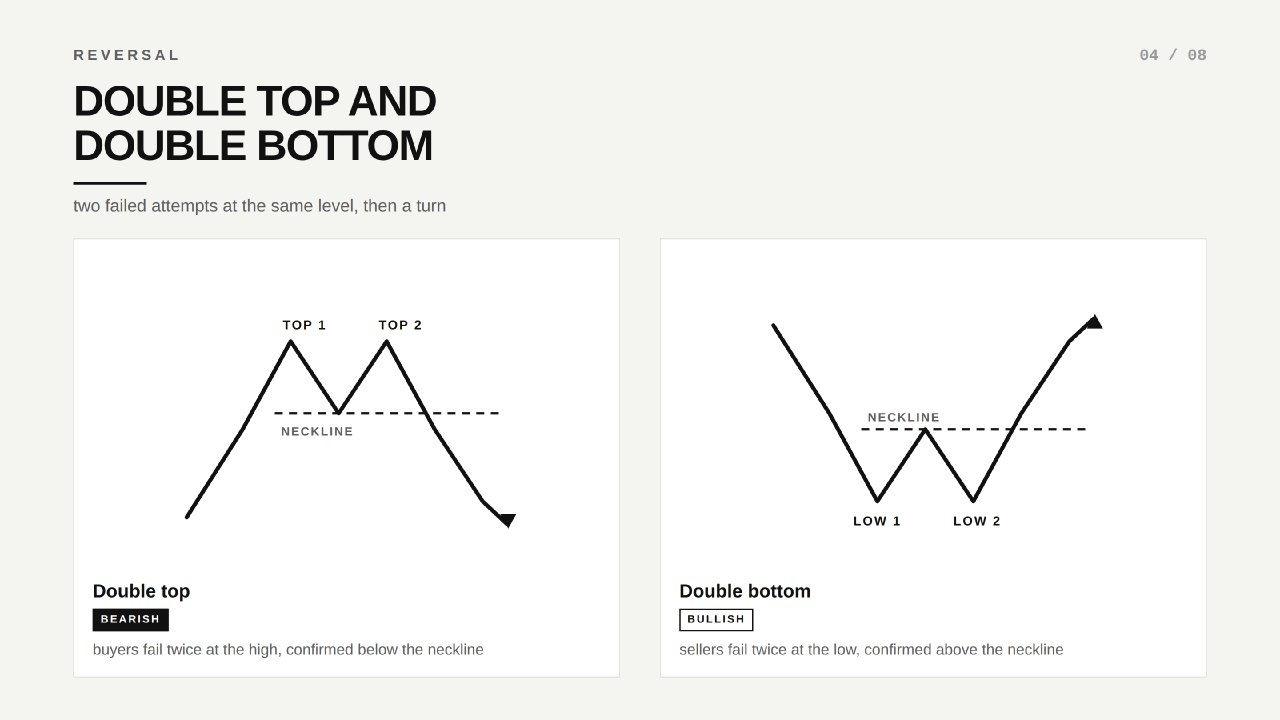
Two failed attempts to break the same level.
Double Top
Price reaches a high twice and fails both times. The dip between them creates the neckline.
A close below the neckline can confirm a bearish reversal.
Double Bottom
Price tests the same low twice and sellers fail to break it.
A close above the neckline can confirm a bullish reversal.
HEAD & SHOULDERS
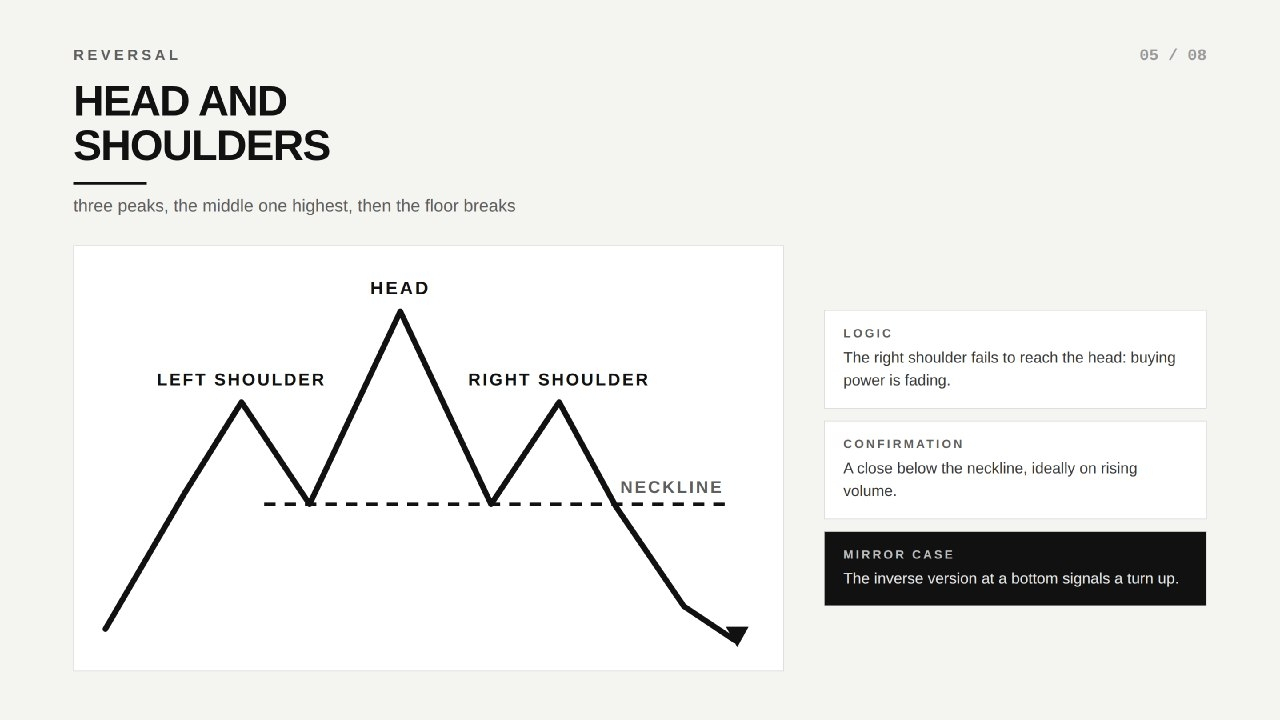
The classic structure has three peaks:
LEFT SHOULDER → HEAD → RIGHT SHOULDER
The middle peak is the highest.
If buyers cannot push the right shoulder toward the head, bullish strength may be fading.
The neckline connects the lows beneath the structure.
A close below the neckline, preferably with increasing volume, strengthens the bearish confirmation.
The inverse Head and Shoulders can appear at market bottoms and signal a potential reversal upward.
THE WEDGE
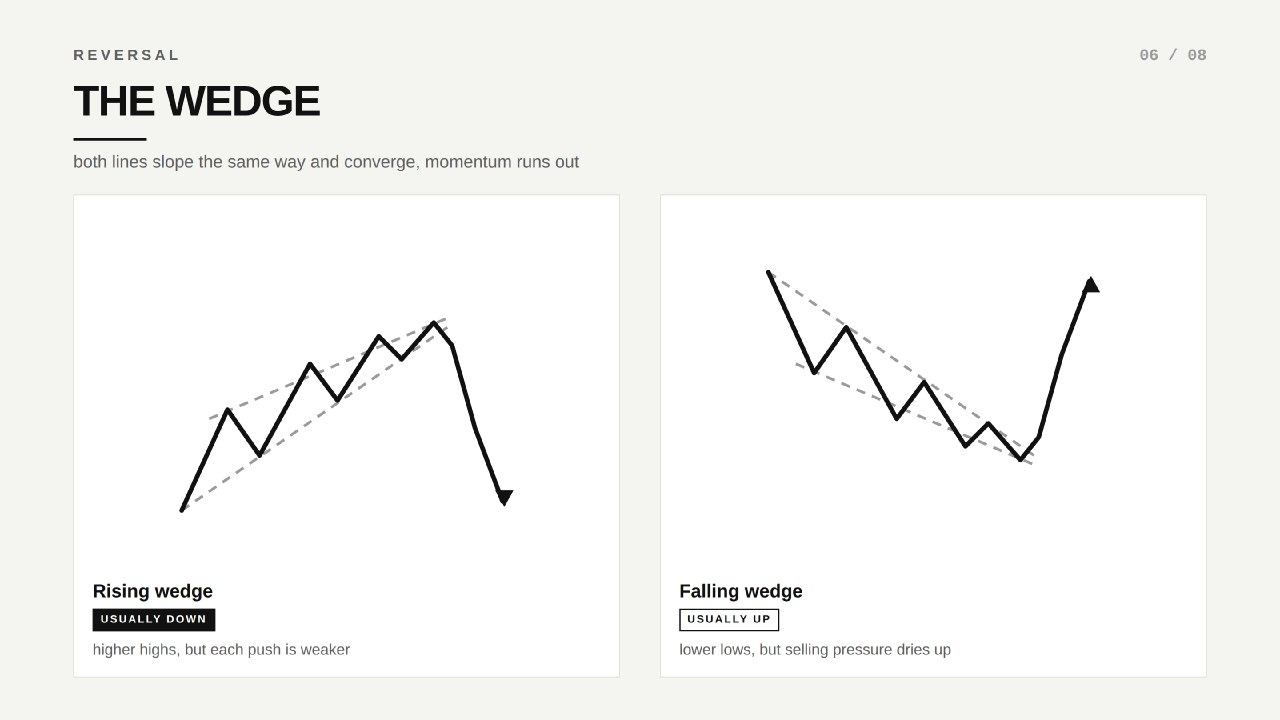
A wedge forms when both trendlines slope in the same direction while gradually converging.
Rising Wedge
Price makes higher highs, but momentum weakens. It most often warns of a potential drop.
Falling Wedge
Price makes lower lows, but selling pressure fades. It most often signals a potential rally.
The interesting part is that a wedge can look like continuation while actually warning that the trend is becoming tired.
HOW TO CONFIRM A PATTERN
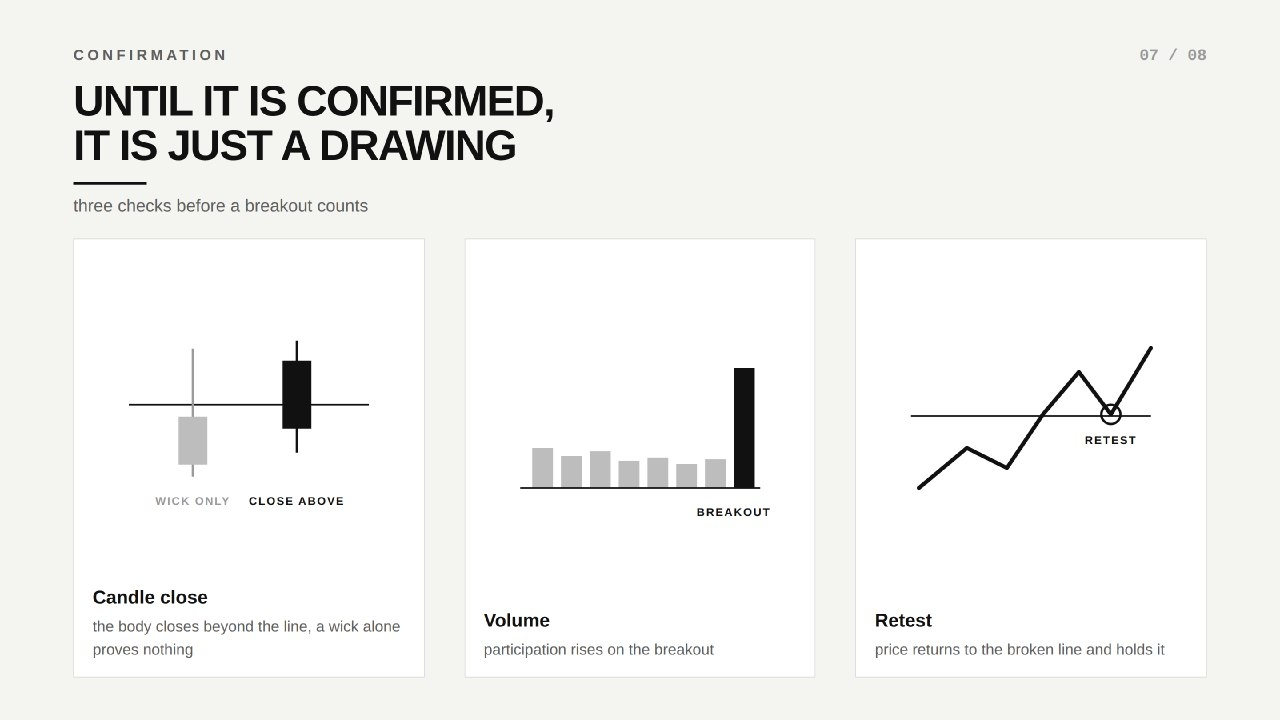
Until a pattern is confirmed, it's just a drawing on the chart.
Candle Close
A wick beyond the level isn't enough. Look for the candle body to close beyond the pattern line.
Volume
A breakout with stronger participation is generally more convincing. Weak-volume breakouts can reverse.
Retest
After breaking out, price may return to test the broken level from the other side.
Resistance → Breakout → Retest → Support
If the level holds, confirmation becomes stronger.
WHERE BEGINNERS MESS UP
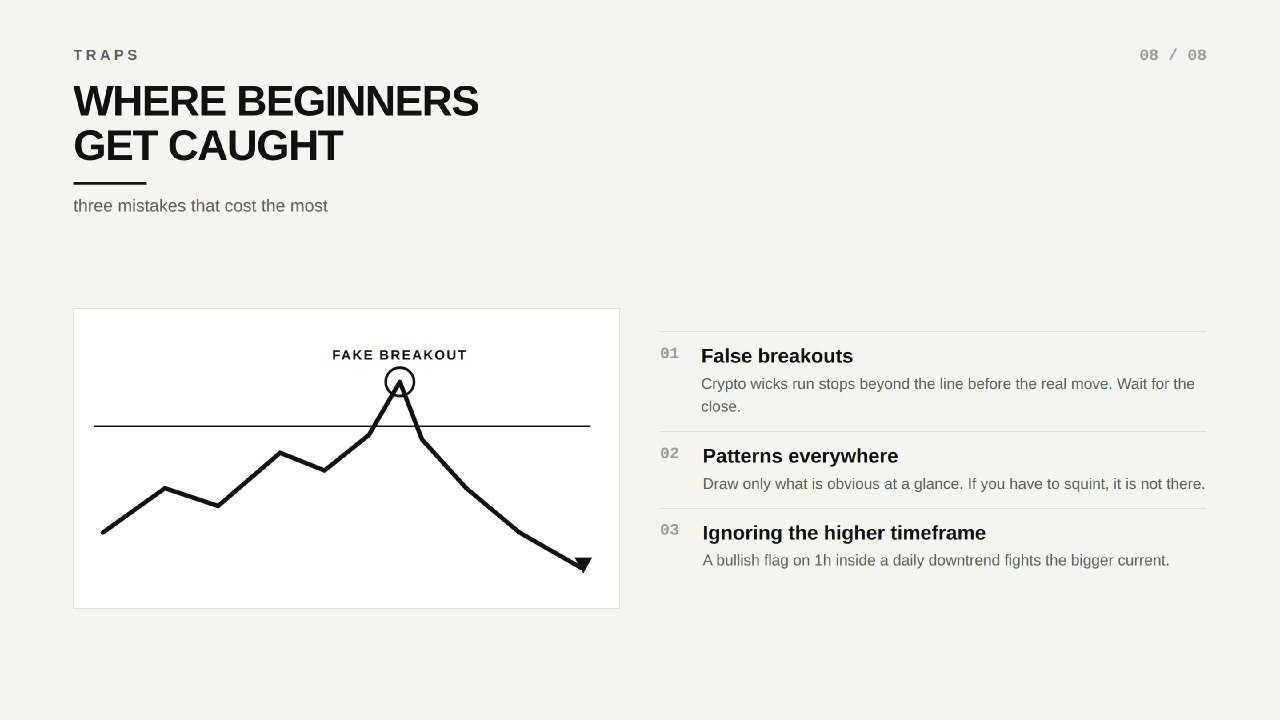
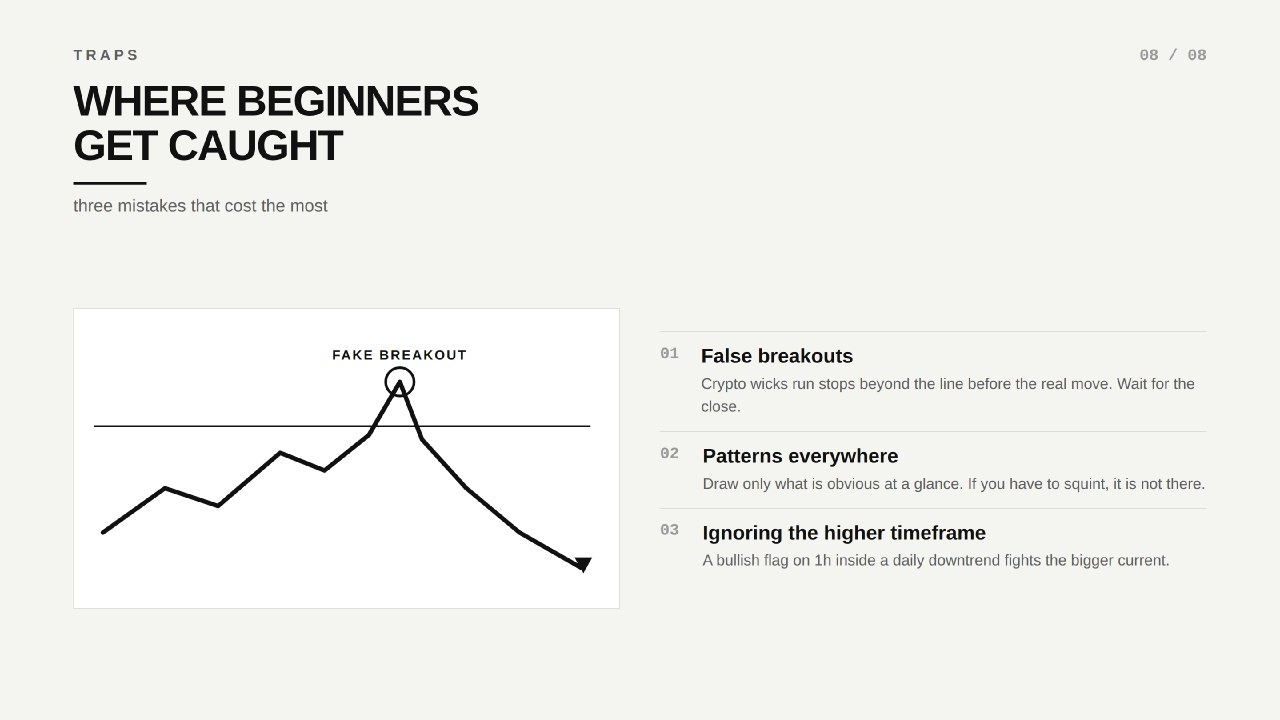
False Breakouts
Crypto can push through a pattern line with a wick, trigger traders, and immediately reverse. Don't enter on the first poke.
Patterns Everywhere
Once you learn patterns, every chart can start looking like one. 😂
If you have to hunt for the formation, it probably isn't clear enough.
Lower Timeframe vs Higher Timeframe
A bullish hourly flag inside a strong daily downtrend may simply be a temporary move against the bigger trend.
Always check:
Higher timeframe → Market direction → Lower timeframe setup
WHAT TO STUDY NEXT
These five patterns are only the starting point.
Other formations include:
Pennants
Rectangles
Cup and Handle
Triple Tops
Triple Bottoms
Broadening Formations
Recommended Study
📚 Thomas Bulkowski — Encyclopedia of Chart Patterns
A major reference with statistics on historical pattern performance.
📚 John Murphy — Technical Analysis of the Financial Markets
A classic technical-analysis resource covering chart patterns and market behaviour.
📚 Robert Edwards & John Magee — Technical Analysis of Stock Trends
A foundational work in traditional technical analysis, first published in 1948.
📚 BabyPips — School of Pipsology
A free, beginner-friendly resource for technical analysis.
FINAL THOUGHT
Theory without practice fades fast.
Study the pattern.
Find it on old charts.
Watch it form live.
Learn how it behaves.
Don't trade a pattern just because you can name it. Wait for confirmation.
And if you made it all the way here:
You're definitely not dumb. 😂📊
🔥 CHAINBALLER
Learn the chart. Understand the crowd. Wait for confirmation.