Solana (SOL) — Latest Analysis 📊
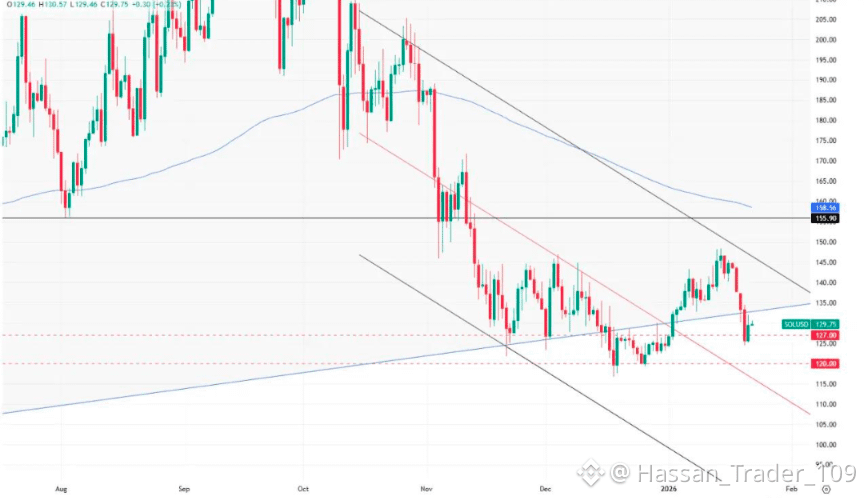
Current $SOL price: around $120–$121 as of October 6, 2026. SOL has been consolidating around $120 after a strong September recovery. �
OKX +1
🔥 Technical outlook
Key resistance
$122–$125 → most important breakout zone.
A convincing daily close above $125 could open the way toward $140–$148. �
crypto.news +1
Above $148, momentum could strengthen substantially.
Key support
$119–$120 → immediate support.
$115 → important downside level.
$109–$111 → stronger support zone.
$104 → around the 50-day moving average and a major trend level. �
CryptoTicker.io
📈 Bullish scenario
If SOL holds $119–120 and breaks $125 with strong volume, I would watch:
$130 → $140 → $148
A break above $148 would provide much stronger evidence that the larger recovery trend is resuming.
📉 Bearish scenario
If SOL loses $115, the setup becomes weaker. A move below $109–111 could bring $104 into focus, with potentially deeper downside if that level fails.
Current technical indicators are mixed-to-bearish on shorter timeframes: Investing.com's October 5 reading showed RSI around 43.6 and MACD negative, while the broader chart still has SOL above its 50- and 200-day averages. �
Investing.com +1
#solana #SolanaStrong #SolanaUSTD #SOL
Current $SOL price: around $120–$121 as of October 6, 2026. SOL has been consolidating around $120 after a strong September recovery. �
OKX +1
🔥 Technical outlook
Key resistance
$122–$125 → most important breakout zone.
A convincing daily close above $125 could open the way toward $140–$148. �
crypto.news +1
Above $148, momentum could strengthen substantially.
Key support
$119–$120 → immediate support.
$115 → important downside level.
$109–$111 → stronger support zone.
$104 → around the 50-day moving average and a major trend level. �
CryptoTicker.io
📈 Bullish scenario
If SOL holds $119–120 and breaks $125 with strong volume, I would watch:
$130 → $140 → $148
A break above $148 would provide much stronger evidence that the larger recovery trend is resuming.
📉 Bearish scenario
If SOL loses $115, the setup becomes weaker. A move below $109–111 could bring $104 into focus, with potentially deeper downside if that level fails.
Current technical indicators are mixed-to-bearish on shorter timeframes: Investing.com's October 5 reading showed RSI around 43.6 and MACD negative, while the broader chart still has SOL above its 50- and 200-day averages. �
Investing.com +1
#solana #SolanaStrong #SolanaUSTD #SOL