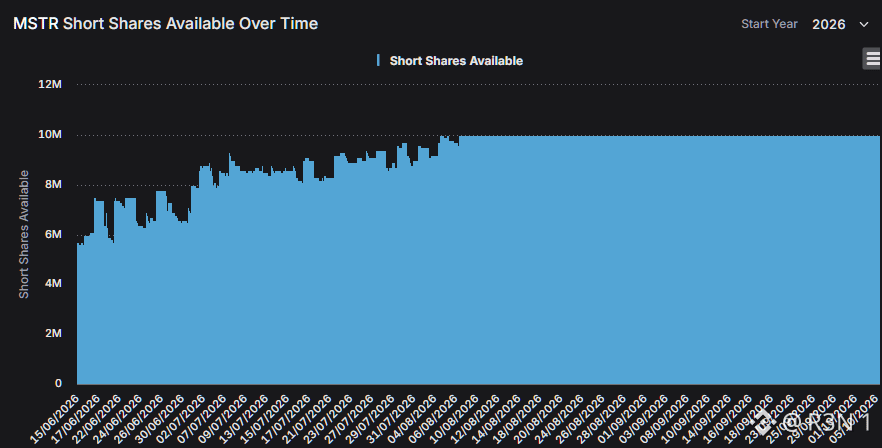
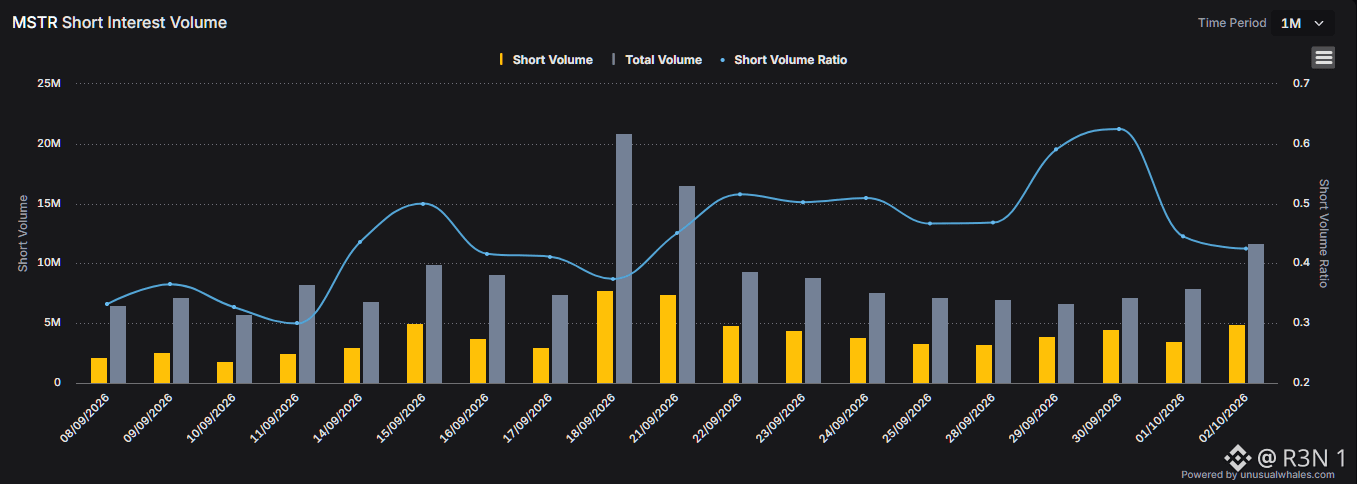
MSTR's short shares available has been pinned at its ceiling, essentially 10 million, since early August, while the actual short volume ratio has swung from 0.3 up to 0.6 and back within the past month alone. That combination is worth separating out, because it tells two different stories about shorting pressure here. The shares available chart climbed steadily from around 6 million in mid June to nearly 10 million by early August, then flatlined at that level through early October. A ceiling like that usually means the lending pool for borrowing shares to short has hit its practical capacity, brokers aren't making meaningfully more supply available, the number's just sitting at its cap rather than continuing to grow. The short volume ratio tells a more dynamic story within that fixed supply. It oscillated in the 0.3 to 0.5 range through most of September, spiked to roughly 0.6, the highest point in this window, around September 29 to 30, then eased back toward 0.4 by October 2. Worth noting the single largest volume day, September 18, total volume spiking to roughly 21 million shares, actually came with a relatively modest short ratio near 0.38 to 0.4, meaning that volume surge wasn't predominantly short driven, more like broad two sided trading. My honest read: a capped lending pool combined with a short ratio that swings this much week to week suggests active positioning changes within a fixed amount of available short capacity, not a steadily building short thesis. The late September ratio spike toward 0.6 is the one point worth flagging specifically, that's genuinely elevated short activity relative to the rest of this chart, even if it's already eased back since. What I'm watching: whether short shares available actually breaks above that roughly 10 million ceiling, which would signal brokers extending more lending capacity, or whether it stays capped while the ratio keeps doing the moving instead. #BTC Price Analysis# #Altcoin Season# $BTC $XAUt


Publier

--
Avertissement : ce contenu inclut des opinions de tiers. Il ne constitue pas un conseil. Binance Ai peut être utilisée, sans garantie de résultat. Consultez les CG.