
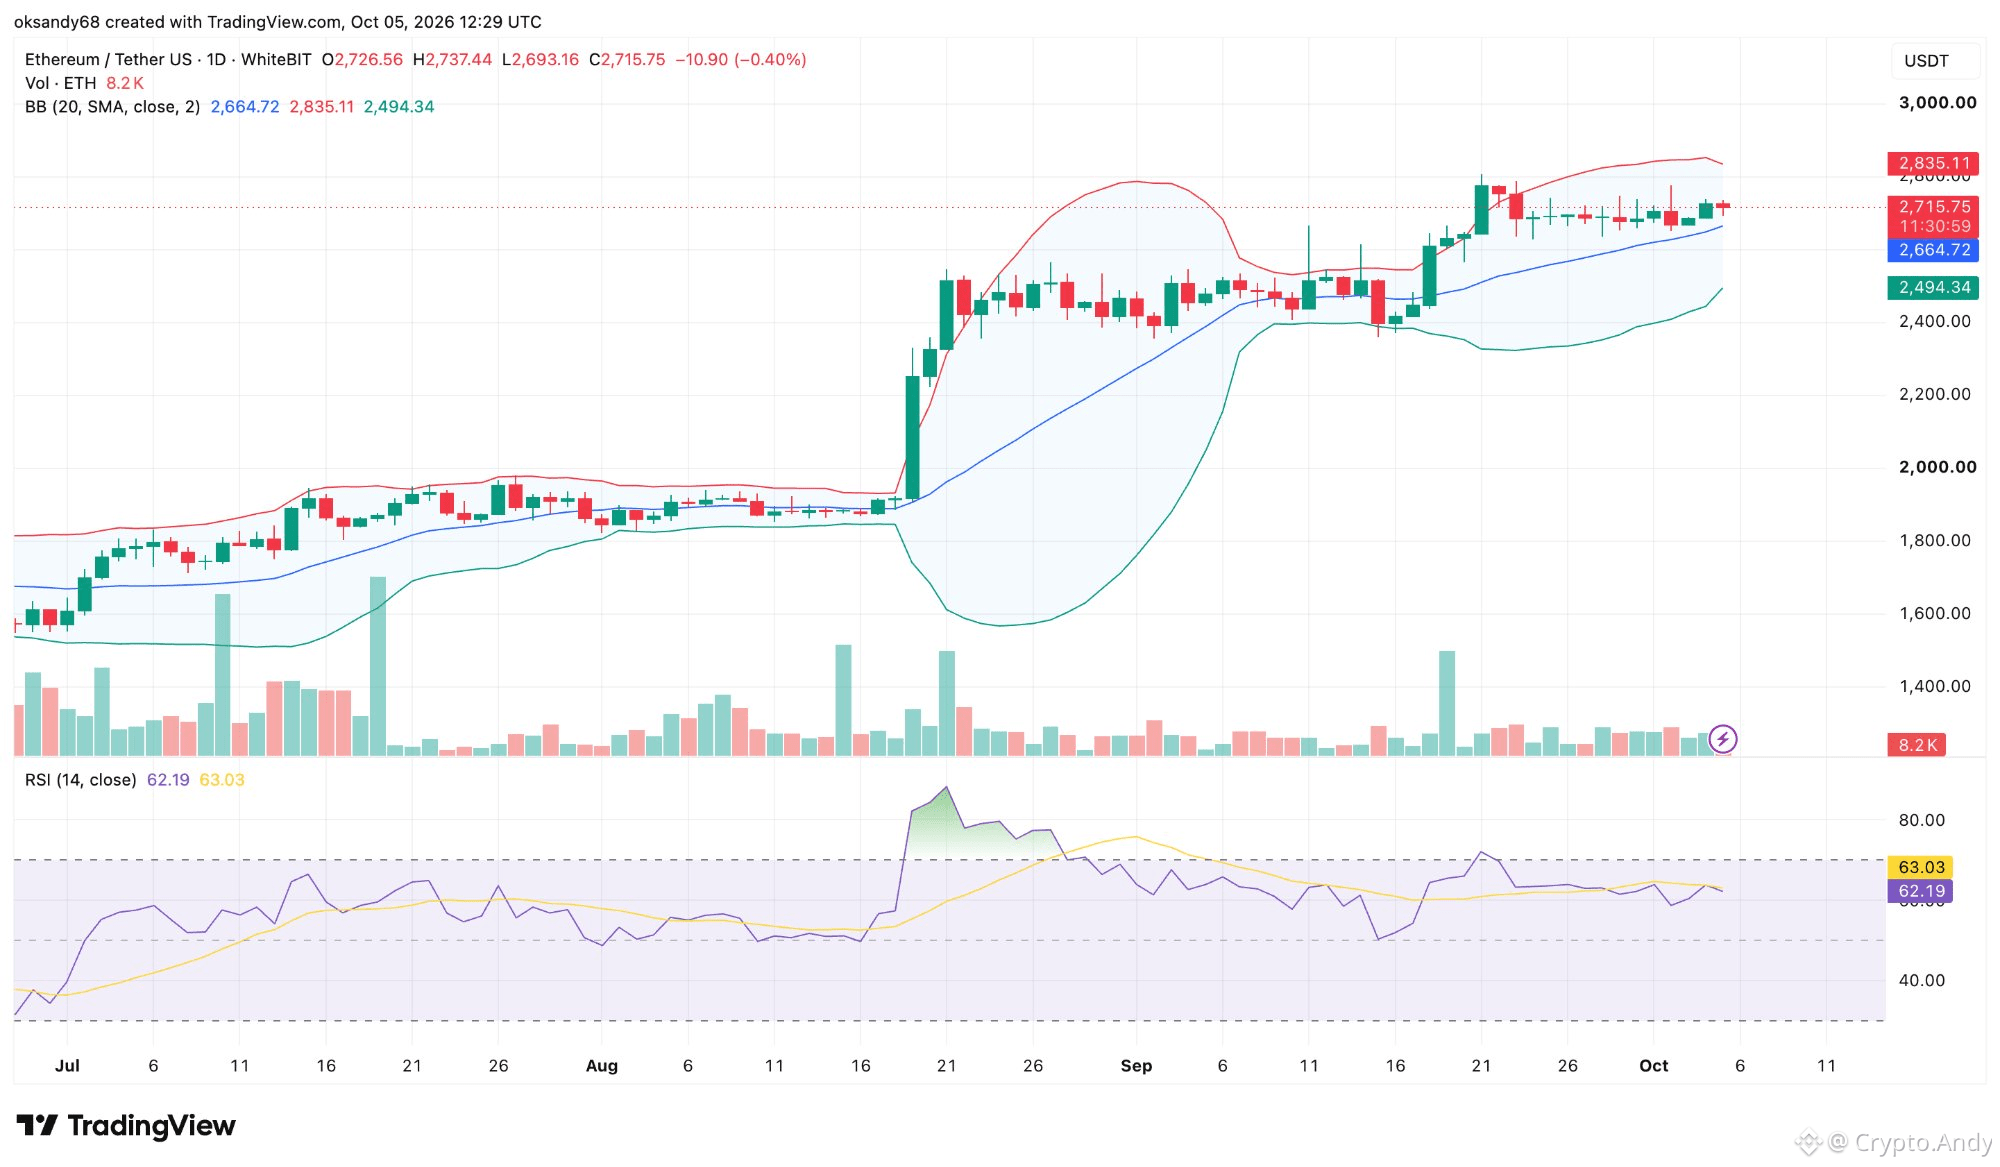
$ETH is coiling up and the chart looks ready for its next move 👀📊 Ethereum has spent the last two weeks in a tight range around $2,700 and the daily chart shows why traders are watching closely. Here's the picture on the ETH/USDT daily chart: 🔹 Price: $2,715 (−0.4% today) 🔹 Range since Sept 21: ~$2,650–$2,750 🔹 Bollinger Bands: middle $2,665, upper $2,835, lower $2,494 🔹 RSI: 62, bullish but not overheated The upper band is flattening while the lower one keeps rising, so the bands are narrowing. A squeeze like this often comes before a sharp move. The 20-day average at ~$2,665 is the level to hold, and ~$2,835 is the first resistance to break 📍 For context, ETH is up ~80% from its June low near $1,500. The fundamentals are getting louder too: 💰 US spot Ether ETFs took in $162.2M on Sept 22 alone 🎯 Tom Lee expects ETH to reclaim its ~$5,000 high by year-end and says $60K is "very possible" in the coming years One more interesting stat: a new Philadelphia Fed study found that ETH traders barely react to whale moves (just a 0.76 p.p. shift in selling activity), while small BTC wallets jump in within 15 minutes of whale alerts 🐋 So what's next: a breakout above $2,835 or one more retest of the middle band? 👇 #ETHBlockchain #ETH #Altcoin Season#


Publier
Avertissement : ce contenu inclut des opinions de tiers. Il ne constitue pas un conseil. Binance Ai peut être utilisée, sans garantie de résultat. Consultez les CG.