$TAO looks bullish on the surface. Momentum is quietly saying something else.
Everyone is watching $341. The real fight is happening $60 lower, and it has a deadline.
Here is what the daily chart is actually saying.
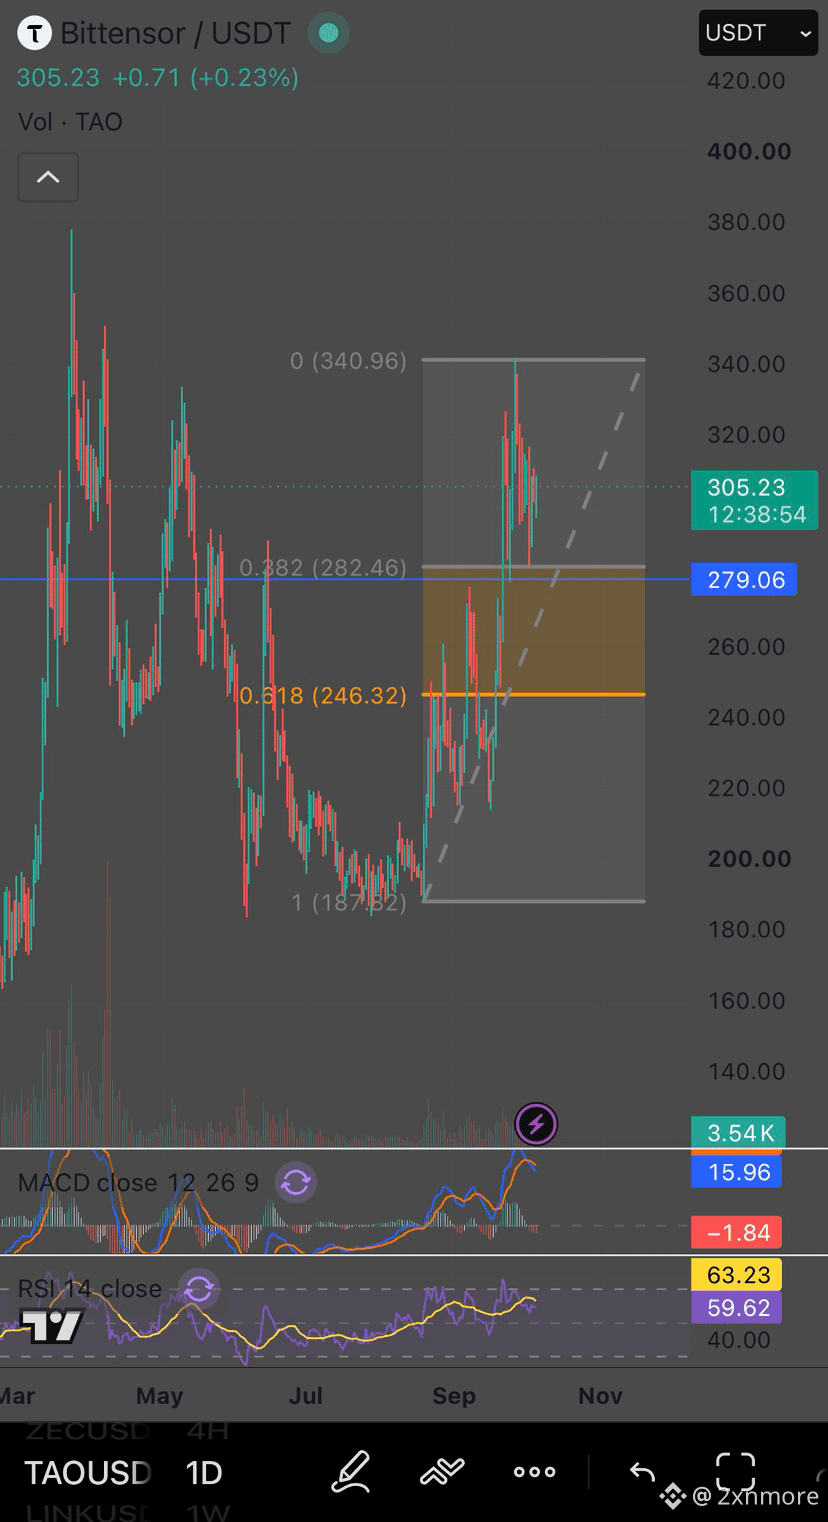
TAO ran from $188 to $341 in about a month. That high lines up with the May top, so sellers had a reason to show up there.
The pullback then found a floor exactly where two tools agree:
$282 → the 0.382 Fibonacci retracement
$279 → old July resistance, now being tested as support
That stacked zone is the entire trade.
Now for the part the green candles are hiding.
MACD has crossed bearish. RSI cooled from overbought to 60 and now sits below its signal line.
Volume on the dip is thin. That reads like profit taking, not distribution.
Meanwhile, the rising trendline from the $188 low is climbing toward the $280 zone by roughly $1.5 to $2 a day.
Price is being squeezed. Within about 10 days, TAO has to choose a direction.
Bull case: it holds $280 on daily closes, MACD curls back up, and $341 gets retested. A close above that level opens the way to $380.
Bear case: a daily close below $279 on rising volume sends it to $264 first, then to the $246 golden pocket.
My whole read comes down to one number.
$280
Above it, every dip is a gift. Below it, patience pays more than conviction.
Which way does it break?
Everyone is watching $341. The real fight is happening $60 lower, and it has a deadline.
Here is what the daily chart is actually saying.
TAO ran from $188 to $341 in about a month. That high lines up with the May top, so sellers had a reason to show up there.
The pullback then found a floor exactly where two tools agree:
$282 → the 0.382 Fibonacci retracement
$279 → old July resistance, now being tested as support
That stacked zone is the entire trade.
Now for the part the green candles are hiding.
MACD has crossed bearish. RSI cooled from overbought to 60 and now sits below its signal line.
Volume on the dip is thin. That reads like profit taking, not distribution.
Meanwhile, the rising trendline from the $188 low is climbing toward the $280 zone by roughly $1.5 to $2 a day.
Price is being squeezed. Within about 10 days, TAO has to choose a direction.
Bull case: it holds $280 on daily closes, MACD curls back up, and $341 gets retested. A close above that level opens the way to $380.
Bear case: a daily close below $279 on rising volume sends it to $264 first, then to the $246 golden pocket.
My whole read comes down to one number.
$280
Above it, every dip is a gift. Below it, patience pays more than conviction.
Which way does it break?