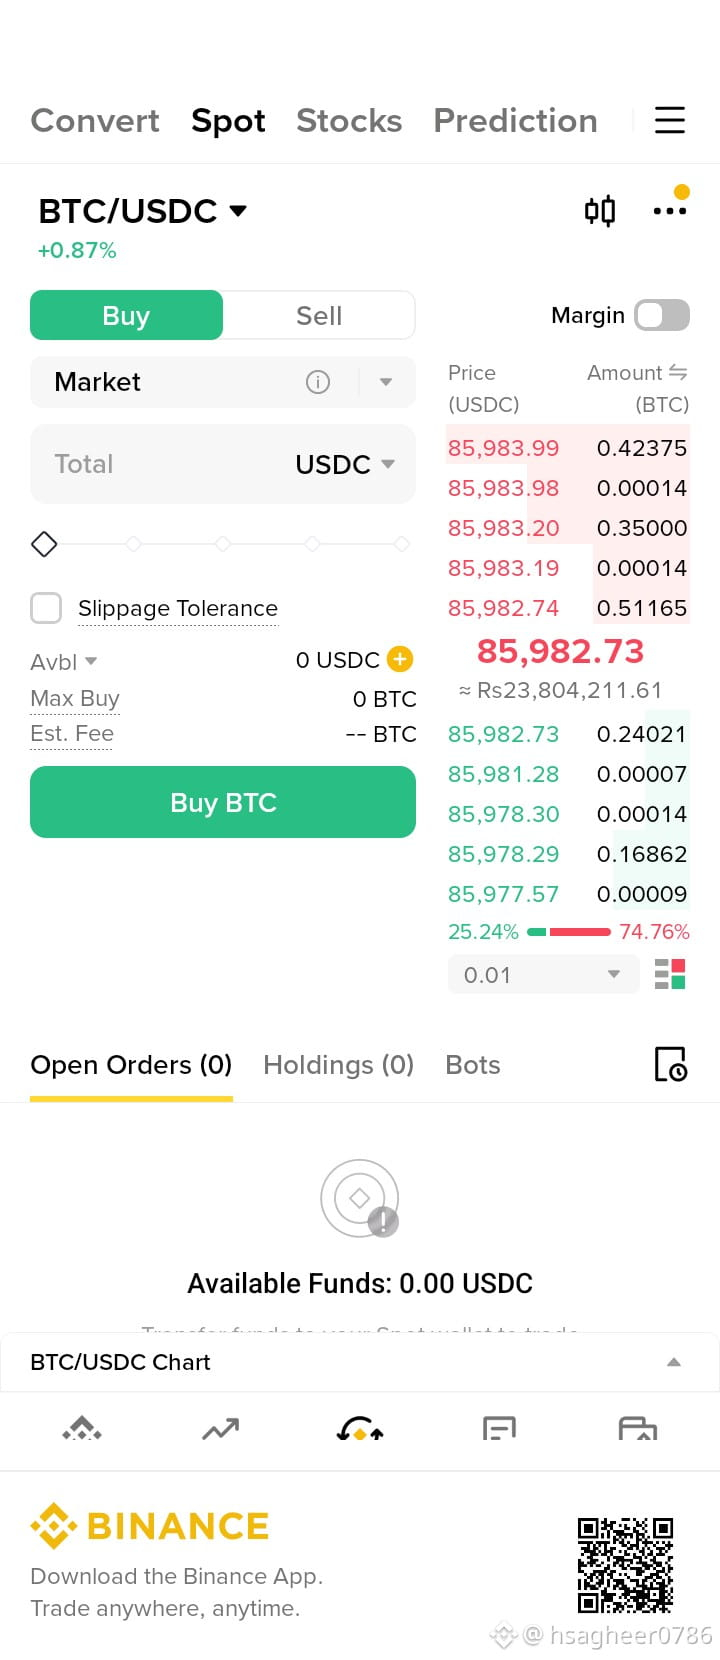
$BTC
$BTC $BTC Bitcoin (BTC) Technical Analysis & Actionable Trading Tips
Bitcoin is holding around the $86,000–$86,500 range, keeping the broader uptrend intact. While short-term momentum signals remain strong, key momentum oscillators warn of local exhaustion.
Key Technical Overview
Trend & Moving Averages: Strong bullish structure across daily and 4-hour timeframes. All major moving averages (5-day, 20-day, 50-day) are stacked positively underneath the current price, acting as multi-layered support levels.
Momentum Indicators:
RSI (14-day): Extended above 84, deep in overbought territory.
MACD: Maintains a positive cross and remains in buy territory.
ATR (Volatility): Elevated, indicating wide daily ranges and prime conditions for sharp liquidity sweeps.
Key Levels to Watch
Level TypePrice RangeTechnical ContextImmediate Resistance$86,750 – $86,950Pivot resistance zone (R1/R2). A clean breakout targeting $88,000+.Primary Support$85,450 – $85,750Confluence of 10/20-day Moving Averages.Critical Risk Pivot$84,350 – $84,500200-day Moving Average boundary; loss of this level invalidates short-term long setups.
Actionable Trading Strategies
1. Long Opportunities (Trend-Following)
Pullback Entry Zone: Avoid buying at resistance while RSI is overbought. Wait for a retest of $85,500 – $85,800 to catch a higher-low structure.
Breakout Confirmation: Look for a 4-hour candle closure above $86,850 backed by rising volume before aiming for psychological resistance at $88,000.
Stop Loss Placement: Place stops below $84,300 to protect against downside cascades.
#BTC突破7万大关 #BTC☀️ #btc走勢 .
$BTC $BTC Bitcoin (BTC) Technical Analysis & Actionable Trading Tips
Bitcoin is holding around the $86,000–$86,500 range, keeping the broader uptrend intact. While short-term momentum signals remain strong, key momentum oscillators warn of local exhaustion.
Key Technical Overview
Trend & Moving Averages: Strong bullish structure across daily and 4-hour timeframes. All major moving averages (5-day, 20-day, 50-day) are stacked positively underneath the current price, acting as multi-layered support levels.
Momentum Indicators:
RSI (14-day): Extended above 84, deep in overbought territory.
MACD: Maintains a positive cross and remains in buy territory.
ATR (Volatility): Elevated, indicating wide daily ranges and prime conditions for sharp liquidity sweeps.
Key Levels to Watch
Level TypePrice RangeTechnical ContextImmediate Resistance$86,750 – $86,950Pivot resistance zone (R1/R2). A clean breakout targeting $88,000+.Primary Support$85,450 – $85,750Confluence of 10/20-day Moving Averages.Critical Risk Pivot$84,350 – $84,500200-day Moving Average boundary; loss of this level invalidates short-term long setups.
Actionable Trading Strategies
1. Long Opportunities (Trend-Following)
Pullback Entry Zone: Avoid buying at resistance while RSI is overbought. Wait for a retest of $85,500 – $85,800 to catch a higher-low structure.
Breakout Confirmation: Look for a 4-hour candle closure above $86,850 backed by rising volume before aiming for psychological resistance at $88,000.
Stop Loss Placement: Place stops below $84,300 to protect against downside cascades.
#BTC突破7万大关 #BTC☀️ #btc走勢 .