
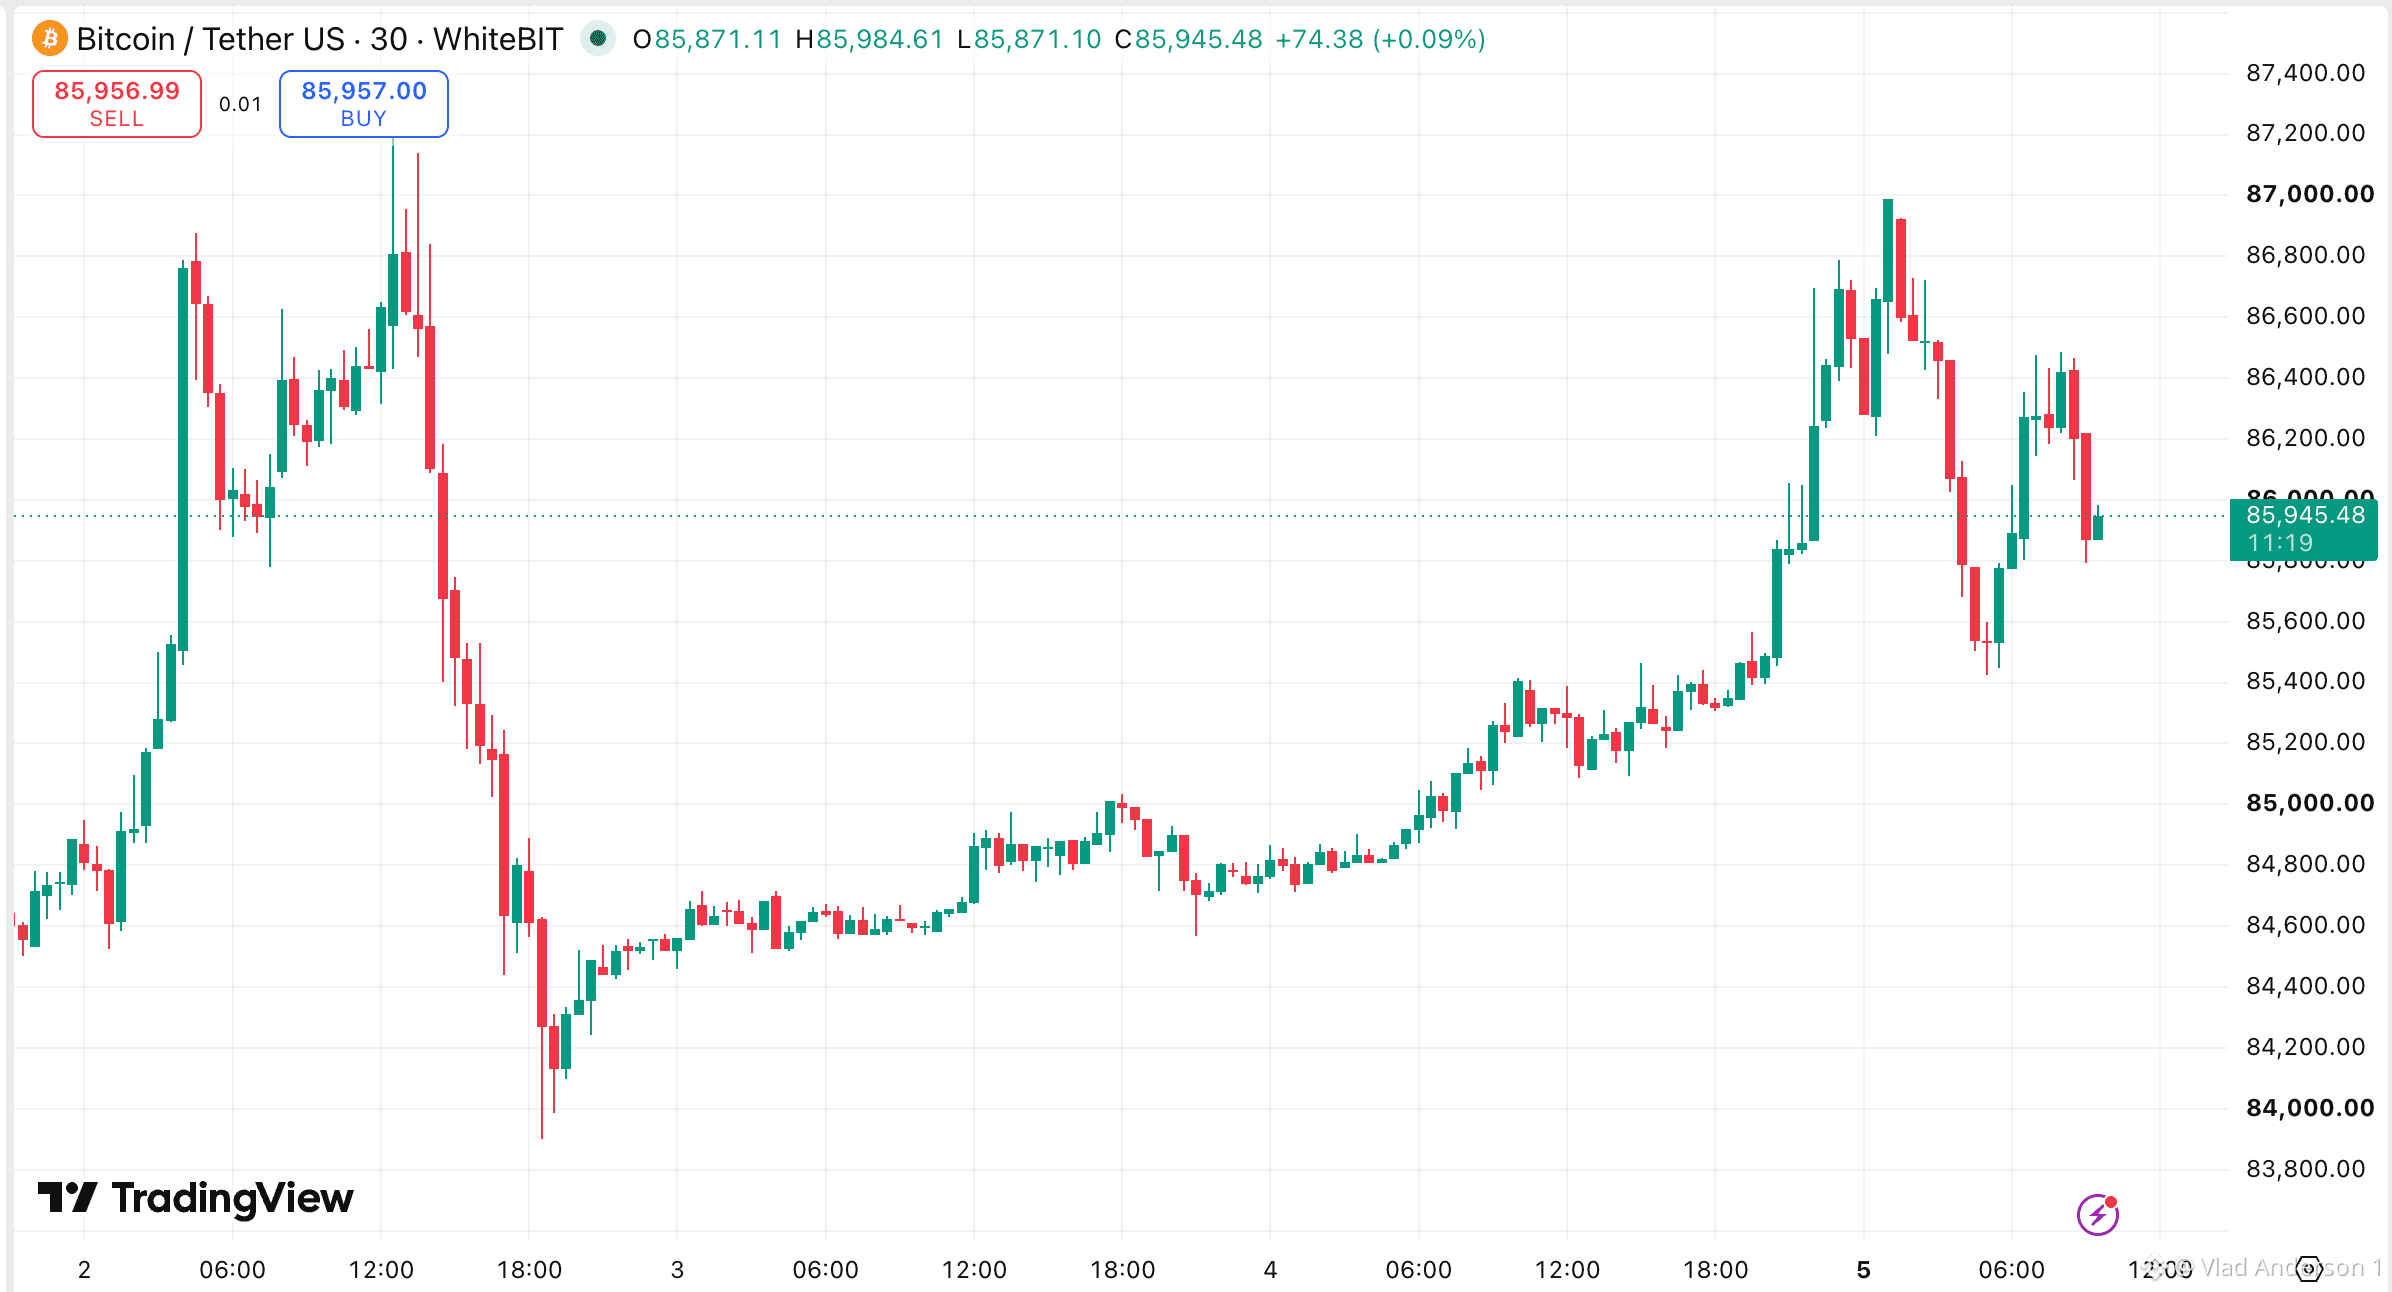
📊 Fear & Greed at 69: Guide to What That Number Means CoinMarketCap's Fear & Greed Index slipped 1 point to 69. Still greed. But a single number hides five different signals for $BTC , so here's how to read it 👇 🧩 WHAT'S INSIDE THE INDEX 🟠 Price momentum → how the top 10 coins by market cap are moving 🟣 Volatility → calm markets push the score up, chaos pushes it down 🔵 Options put/call ratio → more calls than puts means traders are betting on upside 🟢 Stablecoin Supply Ratio (SSR) → how much stablecoin "dry powder" exists relative to BTC 🟡 CMC search data → how many people are suddenly looking up coins 🎨 HOW I READ THE SCALE ⚫ 0-25 → panic. Forced selling, capitulation. Historically the best zone to start paying attention, the worst zone to feel brave 🔴 25-45 → fear. Rallies get sold, bad news hits twice as hard ⚪ 45-55 → neutral. No edge from sentiment, the chart decides 🟢 55-75 → greed. Trend works, dips get bought. Where we are now 🔥 75-100 → euphoria. Leverage piles up, one bad headline can trigger a long flush ⚠️ 3 MISTAKES $BTC PEOPLE MAKE WITH IT 1️⃣ Treating 70 as a sell signal. Greed can last weeks in a healthy uptrend. 2️⃣ Watching the level, not the direction. A drop from 80 to 69 means something different than a climb from 55 to 69. 3️⃣ Forgetting the inputs. A score pushed up by search interest (retail FOMO) is weaker than one driven by options positioning and stablecoin inflows. 📍 WHERE 69 SITS Upper half of the greed zone, drifting lower, not overheated. Sentiment is supportive, but it's no longer adding fuel. #BTC Price Analysis# #Bitcoin Price Prediction: What is Bitcoins next move?#


Publier

Avertissement : ce contenu inclut des opinions de tiers. Il ne constitue pas un conseil. Binance Ai peut être utilisée, sans garantie de résultat. Consultez les CG.