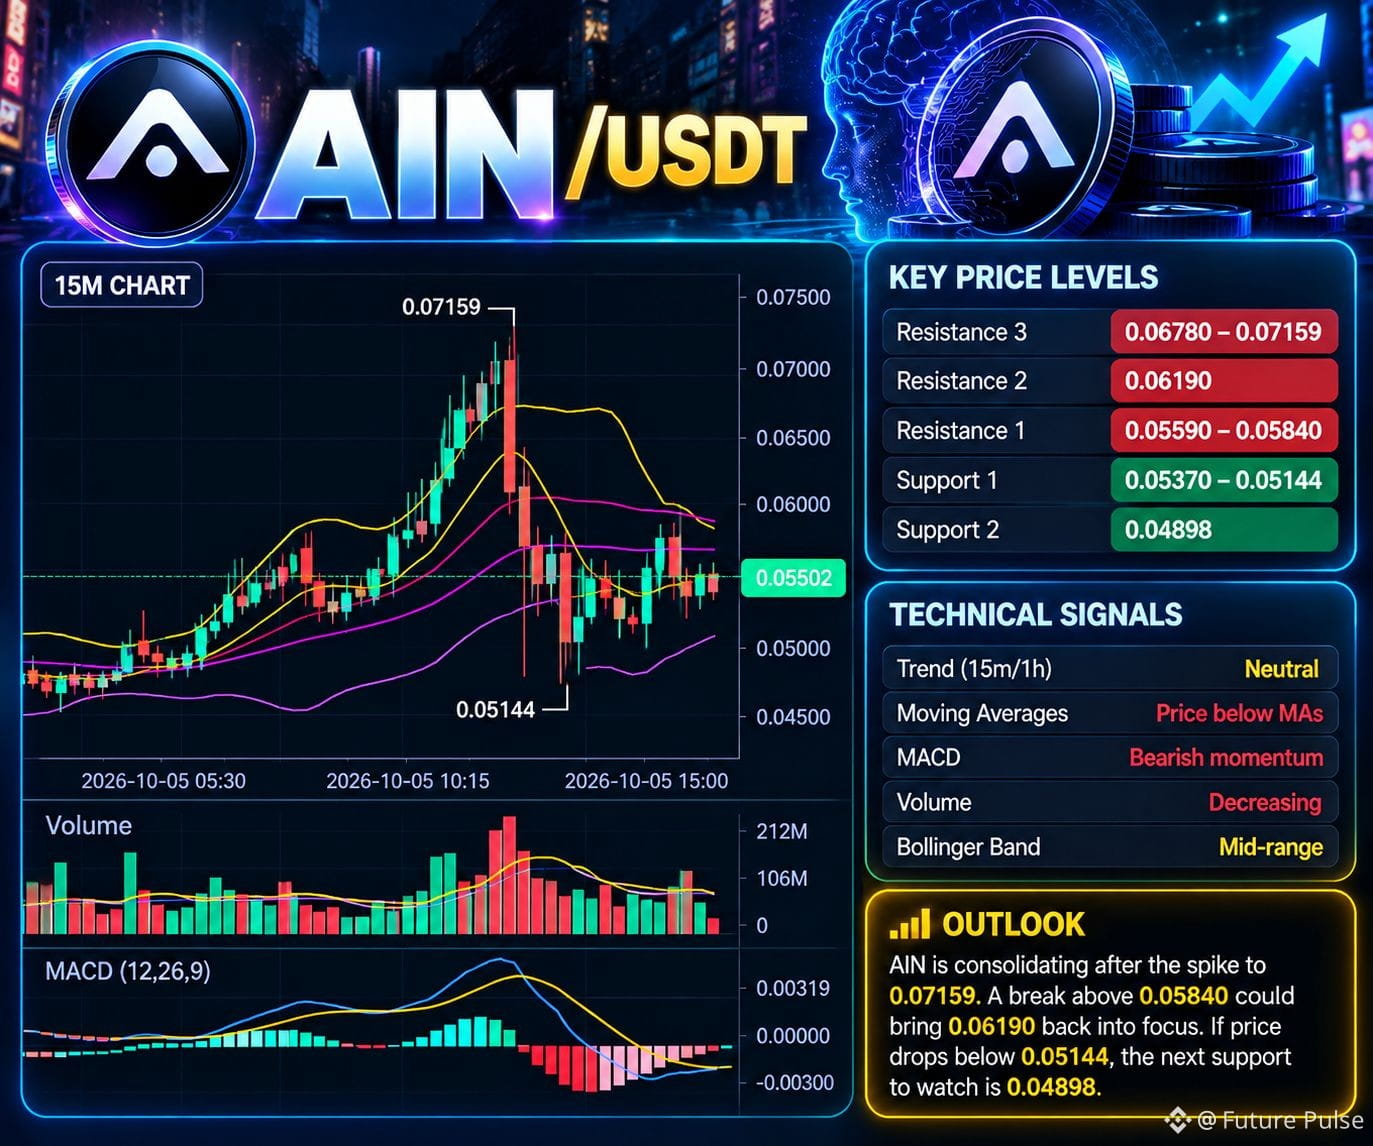

AIN has made a sharp expansion from the 0.023 area, but the charts show a clear shift from explosive momentum to consolidation. After the spike toward 0.07159, price is now holding around 0.055, while the 15M and 1H charts show buyers struggling to regain the short-term moving-average cluster.
🟢 Support 0.05370–0.05144
0.04898 — deeper support
🔴 Resistance 0.05590–0.05840
0.06190 — breakout zone
0.06780–0.07159 — major supply area
I would wait for confirmation rather than chase. A reclaim of 0.05840 with improving momentum could bring 0.06190 back into focus. Conversely, losing 0.05144 would weaken the structure and expose the lower support near 0.04898.
The interesting part here is not the size of the earlier pump—it’s whether AIN can build a new base above the post-breakout range.
$GTC
$BR
$AIN
🟢 Support 0.05370–0.05144
0.04898 — deeper support
🔴 Resistance 0.05590–0.05840
0.06190 — breakout zone
0.06780–0.07159 — major supply area
I would wait for confirmation rather than chase. A reclaim of 0.05840 with improving momentum could bring 0.06190 back into focus. Conversely, losing 0.05144 would weaken the structure and expose the lower support near 0.04898.
The interesting part here is not the size of the earlier pump—it’s whether AIN can build a new base above the post-breakout range.
$GTC
$BR
$AIN