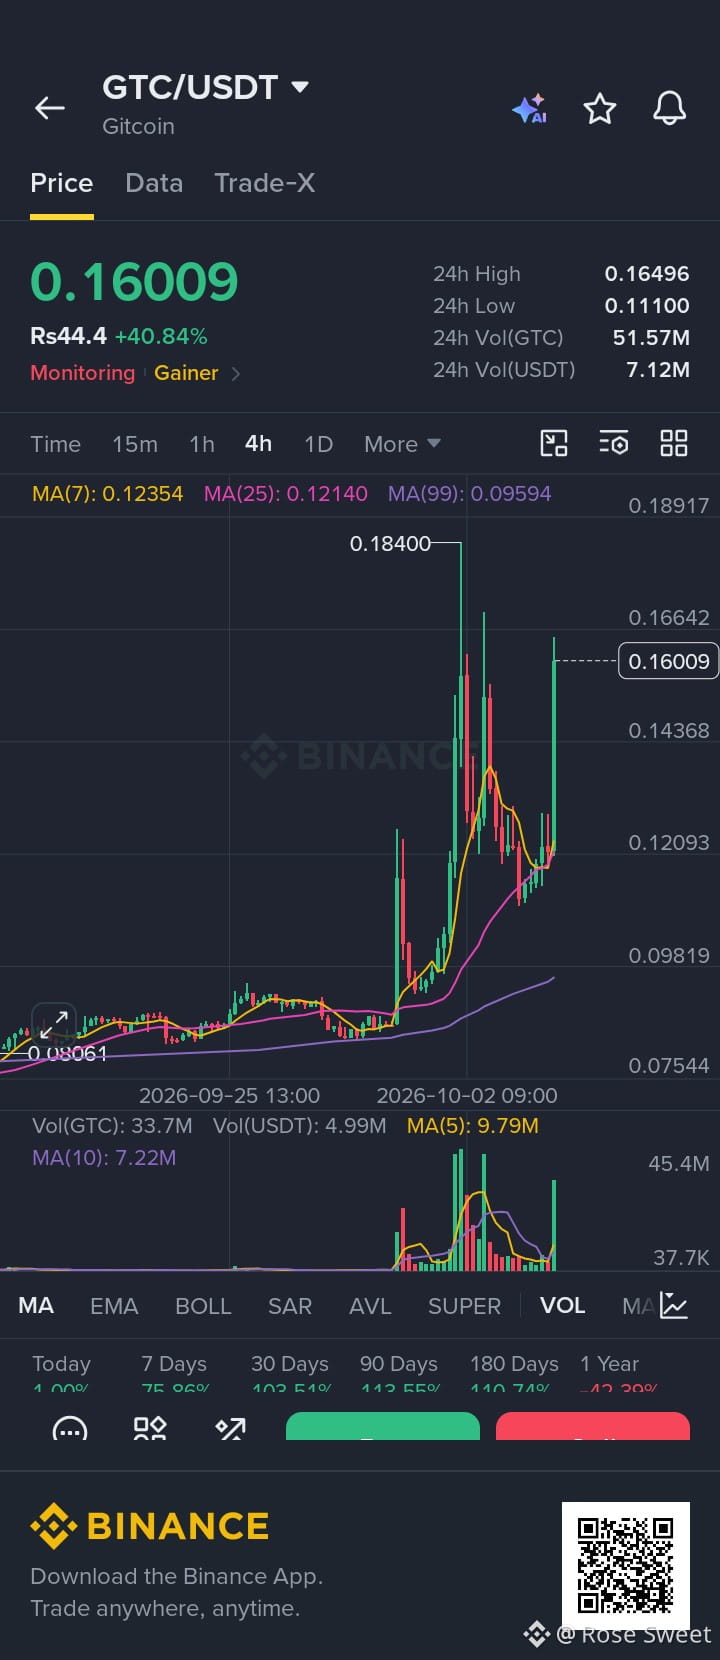
The GTC/USDT chart displays a strong bullish breakout following a long period of low volatility. While the coin is experiencing strong upward momentum and elevated volume (+40.84%), it is also showing high volatility with long candle wicks (e.g., reaching 0.18400 before pulling back). Traders should watch the recent high of 0.18400 USDT as resistance and the 0.12100–0.12300 USDT range (where the short-term MAs converge) as key support.
$GTC
$GIGGLE
$DASH
#EthereumValidatorExitQueueJumps392% #FedOctoberRateHikeOddsFallTo17%
$GTC
$GIGGLE
$DASH
#EthereumValidatorExitQueueJumps392% #FedOctoberRateHikeOddsFallTo17%