📊 $ZEC — 4H TECHNICAL ANALYSIS
🔥 VJ ANALYSIS | TRADE SETUP
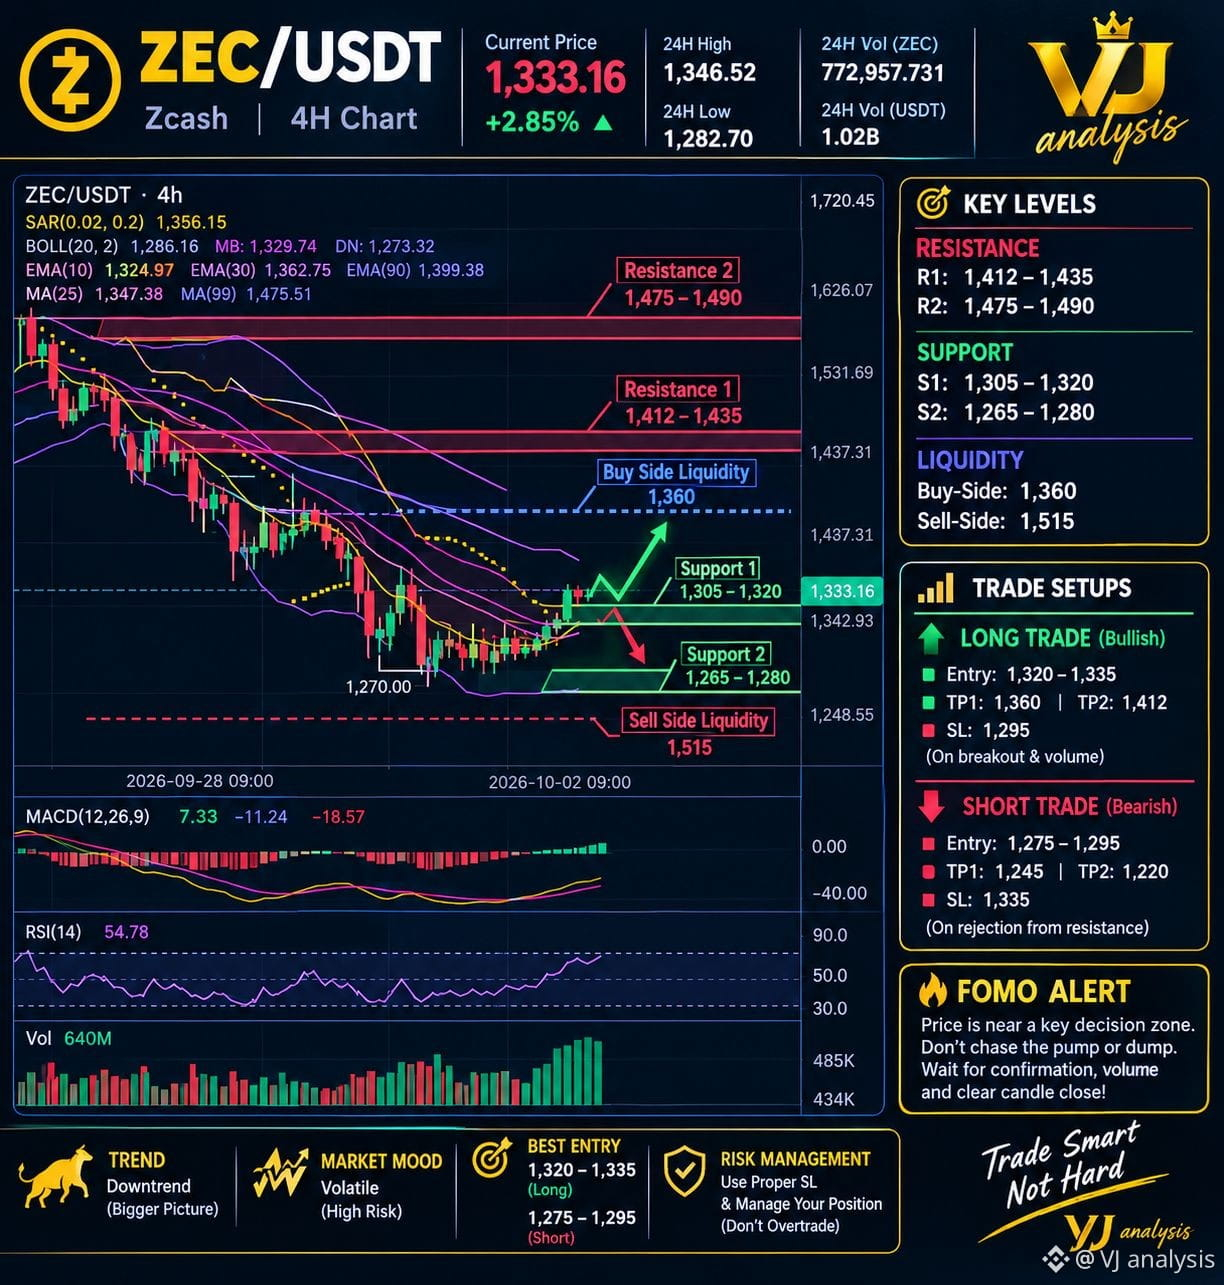
ZEC is trading around 1,333.16, up approximately 2.85% on the session. The 4H chart shows a recovery attempt from the 1,270 area, but the bigger structure remains volatile and requires confirmation before taking a position.
🎯 KEY RESISTANCE #zec
R1: 1,412–1,435
R2: 1,475–1,490
These are the major upside decision zones. A strong 4H breakout above R1 with expanding volume could open the path toward R2. Rejection from these levels may bring sellers back into control.
🟢 KEY SUPPORT #zec
S1: 1,305–1,320
S2: 1,265–1,280
The 1,305–1,320 zone is the first area bulls need to defend. A clean hold here can support another push higher. Losing S1 may expose the deeper 1,265–1,280 demand area.
💧 LIQUIDITY MAP
Buy-side liquidity: around 1,360
Sell-side liquidity: around 1,515
Price is currently approaching the buy-side liquidity area near 1,360, making it an important short-term target and reaction zone.
🟢 LONG SETUP
Entry: 1,320–1,335
TP1: 1,360
TP2: 1,412
SL: 1,295
Look for confirmation, strong candles, and volume before entering.
🔴 SHORT SETUP
Entry: 1,275–1,295
TP1: 1,245
TP2: 1,220
SL: 1,335
This setup becomes more attractive if price rejects resistance or loses support with strong selling volume.
🔥 FOMO ALERT
Do not chase sudden pumps or dumps. The chart can move aggressively around liquidity zones, so patience and confirmation are essential.
📌 TREND: Downtrend on the bigger picture
📌 MARKET MOOD: Volatile / High Risk
📌 BEST LONG ENTRY: 1,320–1,335
📌 BEST SHORT ENTRY: 1,275–1,295
⚠️ Risk management first. Use proper stop-losses, control position size, and never overtrade. This is a technical-analysis scenario, not a guaranteed outcome.
🔥 VJ ANALYSIS — Trade Smart, Not Hard.
Watch the 1,360 reaction closely; reclaiming it can strengthen bullish momentum, while rejection could trigger another move toward lower support levels again today.$ZEC
🔥 VJ ANALYSIS | TRADE SETUP
ZEC is trading around 1,333.16, up approximately 2.85% on the session. The 4H chart shows a recovery attempt from the 1,270 area, but the bigger structure remains volatile and requires confirmation before taking a position.
🎯 KEY RESISTANCE #zec
R1: 1,412–1,435
R2: 1,475–1,490
These are the major upside decision zones. A strong 4H breakout above R1 with expanding volume could open the path toward R2. Rejection from these levels may bring sellers back into control.
🟢 KEY SUPPORT #zec
S1: 1,305–1,320
S2: 1,265–1,280
The 1,305–1,320 zone is the first area bulls need to defend. A clean hold here can support another push higher. Losing S1 may expose the deeper 1,265–1,280 demand area.
💧 LIQUIDITY MAP
Buy-side liquidity: around 1,360
Sell-side liquidity: around 1,515
Price is currently approaching the buy-side liquidity area near 1,360, making it an important short-term target and reaction zone.
🟢 LONG SETUP
Entry: 1,320–1,335
TP1: 1,360
TP2: 1,412
SL: 1,295
Look for confirmation, strong candles, and volume before entering.
🔴 SHORT SETUP
Entry: 1,275–1,295
TP1: 1,245
TP2: 1,220
SL: 1,335
This setup becomes more attractive if price rejects resistance or loses support with strong selling volume.
🔥 FOMO ALERT
Do not chase sudden pumps or dumps. The chart can move aggressively around liquidity zones, so patience and confirmation are essential.
📌 TREND: Downtrend on the bigger picture
📌 MARKET MOOD: Volatile / High Risk
📌 BEST LONG ENTRY: 1,320–1,335
📌 BEST SHORT ENTRY: 1,275–1,295
⚠️ Risk management first. Use proper stop-losses, control position size, and never overtrade. This is a technical-analysis scenario, not a guaranteed outcome.
🔥 VJ ANALYSIS — Trade Smart, Not Hard.
Watch the 1,360 reaction closely; reclaiming it can strengthen bullish momentum, while rejection could trigger another move toward lower support levels again today.$ZEC