Why is $ZEC sitting right below a price gap it hasn't filled — and does that gap act like a magnet or a wall?
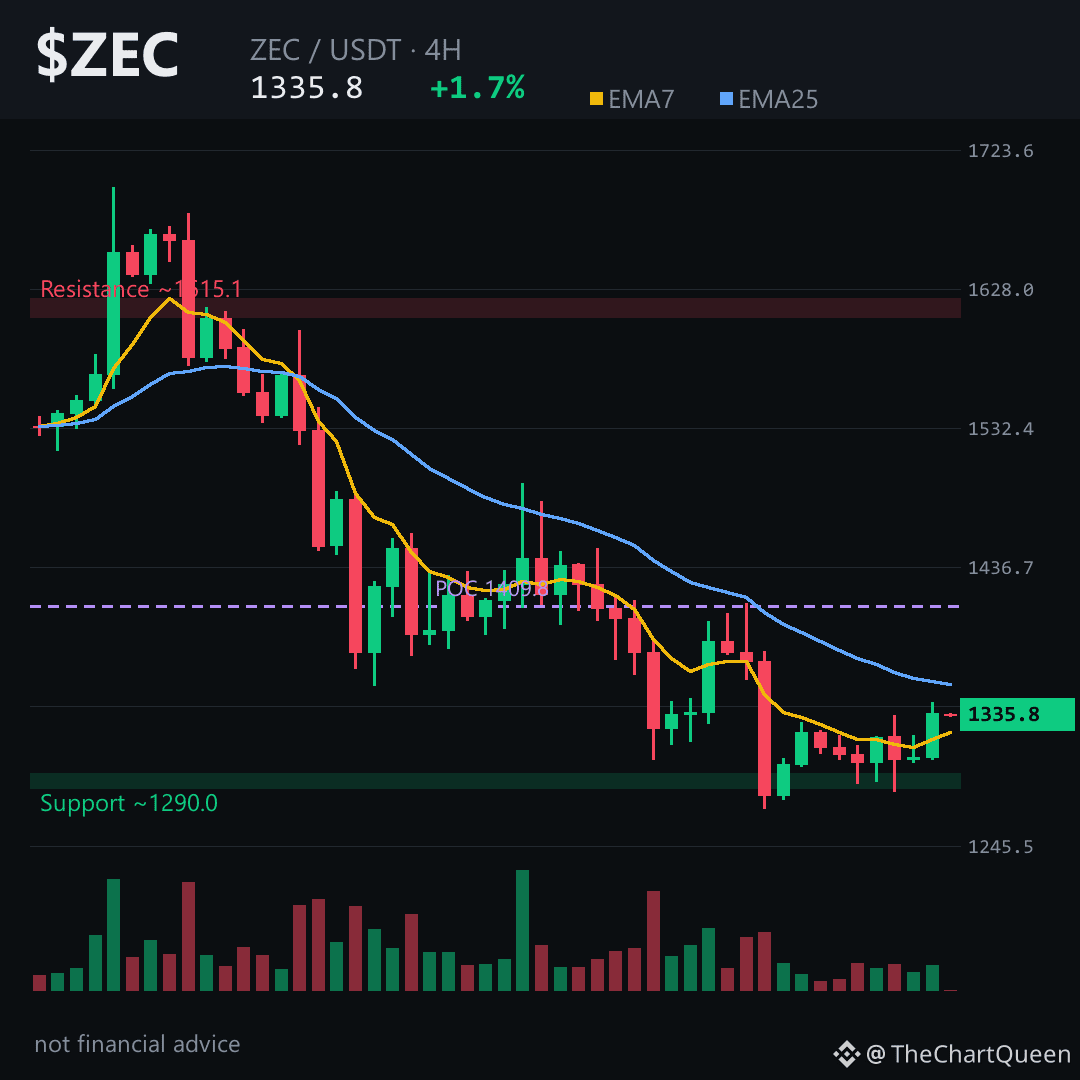
The 4-hour chart shows price hovering near 1340, with short-term moving averages sloping down — a classic cooling-off after a sharp drop. RSI at 45 means there's still room to fall. Volume is thin, so moves can be fast but less reliable.
Funding is barely positive, and the long/short ratio is below 1 — most futures traders are short. That’s often a contrarian setup for a squeeze if price reclaims a key level.
The key zone: an unfilled gap between roughly 1305 and 1360. Price is inside it now. Lose 1305 on a 4-hour close, and the next target is 1220. Push above 1410, and the bearish read is invalid. Tap $ZEC to pull up the chart and see that gap yourself.
My read: path of least resistance is still down until price proves it can hold above 1360. Real risk is a short squeeze if that breaks.
I'll update when the gap resolves — follow if you want it.
Which level are you watching more closely on $ZEC — 1305 or 1410? 👇
⚠️ Not financial advice. DYOR.
#ZEC #Zcash #Crypto #BinanceSquare
The 4-hour chart shows price hovering near 1340, with short-term moving averages sloping down — a classic cooling-off after a sharp drop. RSI at 45 means there's still room to fall. Volume is thin, so moves can be fast but less reliable.
Funding is barely positive, and the long/short ratio is below 1 — most futures traders are short. That’s often a contrarian setup for a squeeze if price reclaims a key level.
The key zone: an unfilled gap between roughly 1305 and 1360. Price is inside it now. Lose 1305 on a 4-hour close, and the next target is 1220. Push above 1410, and the bearish read is invalid. Tap $ZEC to pull up the chart and see that gap yourself.
My read: path of least resistance is still down until price proves it can hold above 1360. Real risk is a short squeeze if that breaks.
I'll update when the gap resolves — follow if you want it.
Which level are you watching more closely on $ZEC — 1305 or 1410? 👇
⚠️ Not financial advice. DYOR.
#ZEC #Zcash #Crypto #BinanceSquare