👀 PHAROS — The Silent Mover Is Starting to Make Noise
I nearly scrolled past this one.
Then I opened the higher timeframes.
PHAROS is already +94% in 30 days — but the interesting part for me isn’t that number. It’s how the chart got here.
📊 What I see on the chart
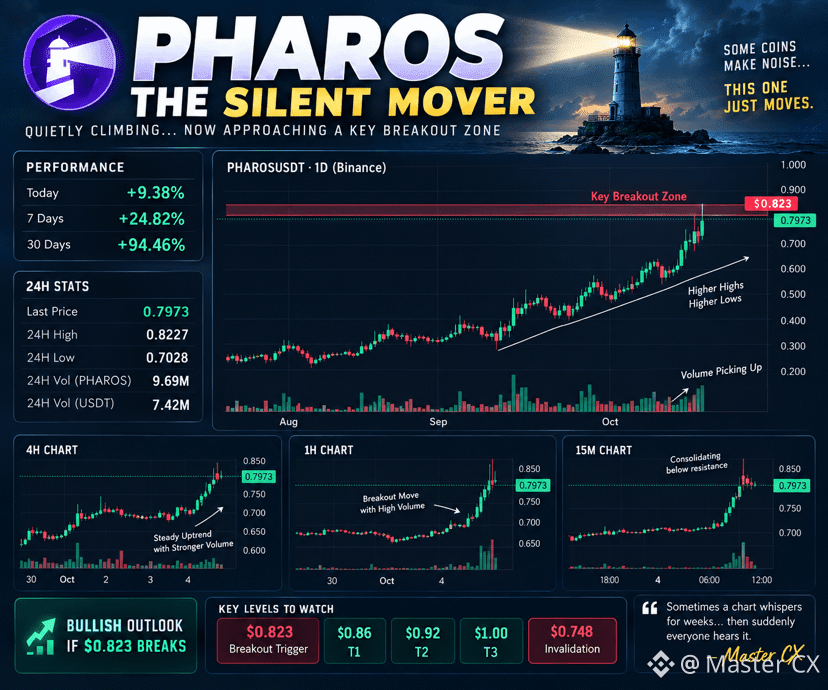
1D: The structure has been building for weeks. After spending much of August/early September around the $0.35–$0.45 region, price started producing a clear series of higher lows and higher highs. This doesn’t look like one random green candle.
4H: The staircase is even clearer. Buyers repeatedly defended pullbacks and price has now pushed above the recent ~$0.75 area. The latest expansion candle also arrived with stronger volume.
1H: This is where things suddenly got interesting. PHAROS accelerated from roughly $0.71 → $0.80, accompanied by a major volume spike. Momentum has clearly changed — but after such a vertical move, I’m not chasing.
15M: Price is now consolidating just underneath today’s $0.8227 high after the impulse. That’s the battle I’m watching.
🎯 My line in the sand: $0.823
If PHAROS trades through that level, the breakout becomes interesting to me.
Watch: $0.823
T1: $0.86
T2: $0.92
T3: $1.00
Invalidation: $0.748
One thing I don’t like? The screenshots show the visible order book leaning toward the ask side, so sellers haven’t disappeared. That’s another reason I prefer confirmation over FOMO.
Daily trend ✅
4H structure ✅
1H volume expansion ✅
15M sitting under resistance 👀
Sometimes a chart whispers for weeks…
then suddenly everyone hears it.
PHAROS goes on my Silent Mover Watch. 🐾
—Master CX
$PHAROS
I nearly scrolled past this one.
Then I opened the higher timeframes.
PHAROS is already +94% in 30 days — but the interesting part for me isn’t that number. It’s how the chart got here.
📊 What I see on the chart
1D: The structure has been building for weeks. After spending much of August/early September around the $0.35–$0.45 region, price started producing a clear series of higher lows and higher highs. This doesn’t look like one random green candle.
4H: The staircase is even clearer. Buyers repeatedly defended pullbacks and price has now pushed above the recent ~$0.75 area. The latest expansion candle also arrived with stronger volume.
1H: This is where things suddenly got interesting. PHAROS accelerated from roughly $0.71 → $0.80, accompanied by a major volume spike. Momentum has clearly changed — but after such a vertical move, I’m not chasing.
15M: Price is now consolidating just underneath today’s $0.8227 high after the impulse. That’s the battle I’m watching.
🎯 My line in the sand: $0.823
If PHAROS trades through that level, the breakout becomes interesting to me.
Watch: $0.823
T1: $0.86
T2: $0.92
T3: $1.00
Invalidation: $0.748
One thing I don’t like? The screenshots show the visible order book leaning toward the ask side, so sellers haven’t disappeared. That’s another reason I prefer confirmation over FOMO.
Daily trend ✅
4H structure ✅
1H volume expansion ✅
15M sitting under resistance 👀
Sometimes a chart whispers for weeks…
then suddenly everyone hears it.
PHAROS goes on my Silent Mover Watch. 🐾
—Master CX
$PHAROS