
Is BNB quietly stacking a bullish stack right now?
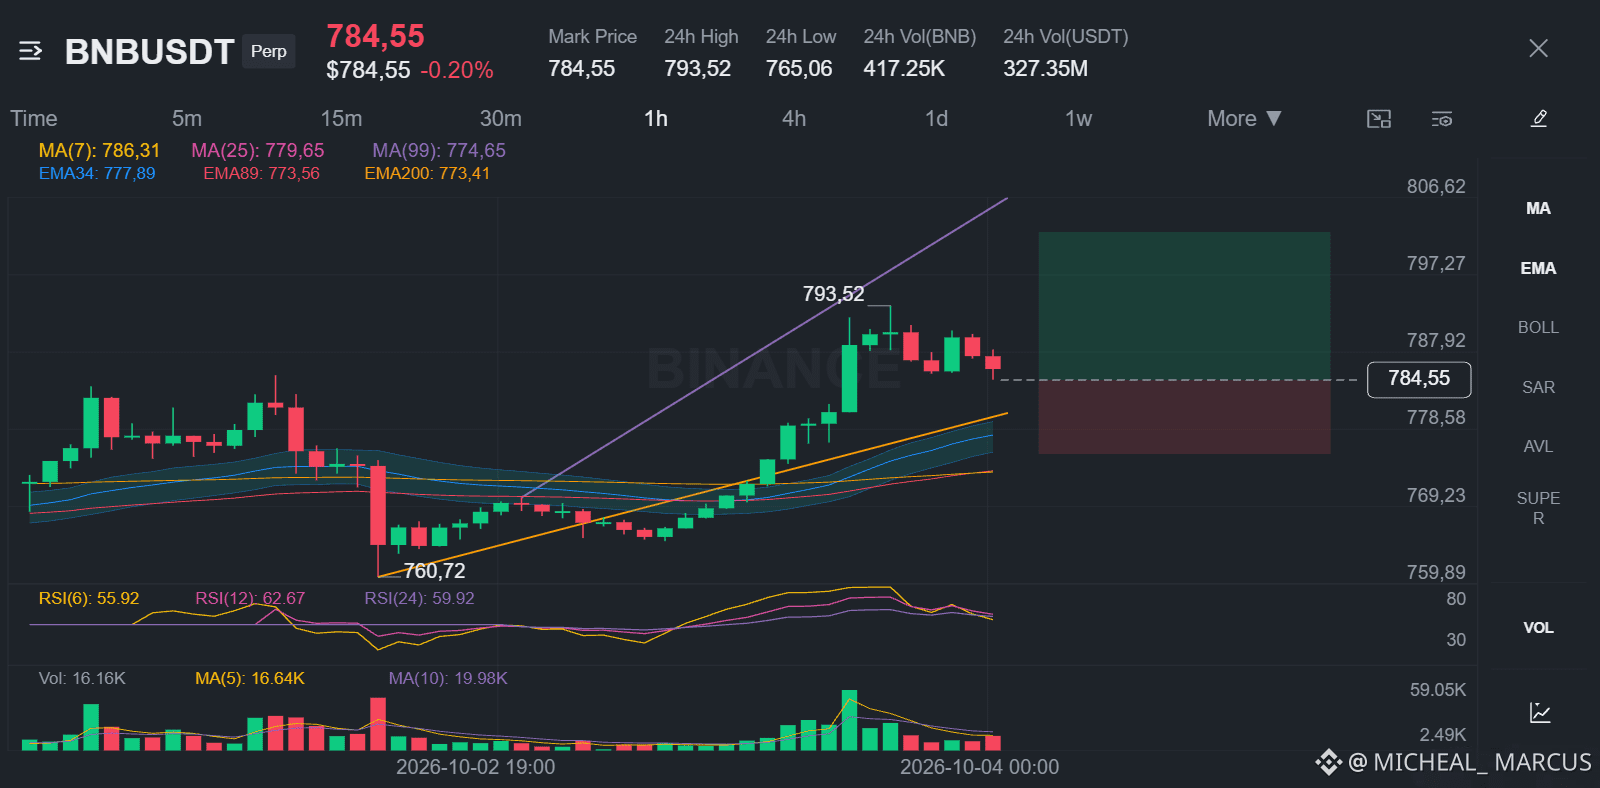
🟢 LONG $BNB /USDT: expecting price to go UP
Bias: LONG · Strong
Entry: 784.156 – 784.944
TP1: 791.260 (+0.9%)
TP2: 795.733 (+1.4%)
TP3: 802.443 (+2.3%)
SL: 775.603 (-1.1%)
Plan: enter only inside the zone, take half at TP1, then move the stop to entry.
Why LONG? BNB checklist: 6/12 signals agree, 1 against, 5 undecided
• Daily trend: price > EMA50 > EMA200, bullish stack → the big-picture trend is up
• 4h trend: price > EMA50 > EMA200, bullish stack → the swing trend is up
• 1h trend: price > EMA50 > EMA200, bullish stack → the short-term trend is up
Watch: Trend strength (ADX/DI, 15m): ADX 24.1 with sellers in control (DI+ 17.2 vs DI− 29.0) → sellers are driving the move
Watch: The idea is wrong if price reaches the stop at 775.603Bottom line: The daily trend is bullish with price above EMA50 and EMA200, while the 15-minute ADX shows sellers driving the move with DI+ at 17.2 versus DI- at 29.0.
If you are on the daily bullish stack, what level would make you take profits instead of waiting for TP3?
Chart with every level below.
🟢 LONG $BNB /USDT: expecting price to go UP
Bias: LONG · Strong
Entry: 784.156 – 784.944
TP1: 791.260 (+0.9%)
TP2: 795.733 (+1.4%)
TP3: 802.443 (+2.3%)
SL: 775.603 (-1.1%)
Plan: enter only inside the zone, take half at TP1, then move the stop to entry.
Why LONG? BNB checklist: 6/12 signals agree, 1 against, 5 undecided
• Daily trend: price > EMA50 > EMA200, bullish stack → the big-picture trend is up
• 4h trend: price > EMA50 > EMA200, bullish stack → the swing trend is up
• 1h trend: price > EMA50 > EMA200, bullish stack → the short-term trend is up
Watch: Trend strength (ADX/DI, 15m): ADX 24.1 with sellers in control (DI+ 17.2 vs DI− 29.0) → sellers are driving the move
Watch: The idea is wrong if price reaches the stop at 775.603Bottom line: The daily trend is bullish with price above EMA50 and EMA200, while the 15-minute ADX shows sellers driving the move with DI+ at 17.2 versus DI- at 29.0.
If you are on the daily bullish stack, what level would make you take profits instead of waiting for TP3?
Chart with every level below.