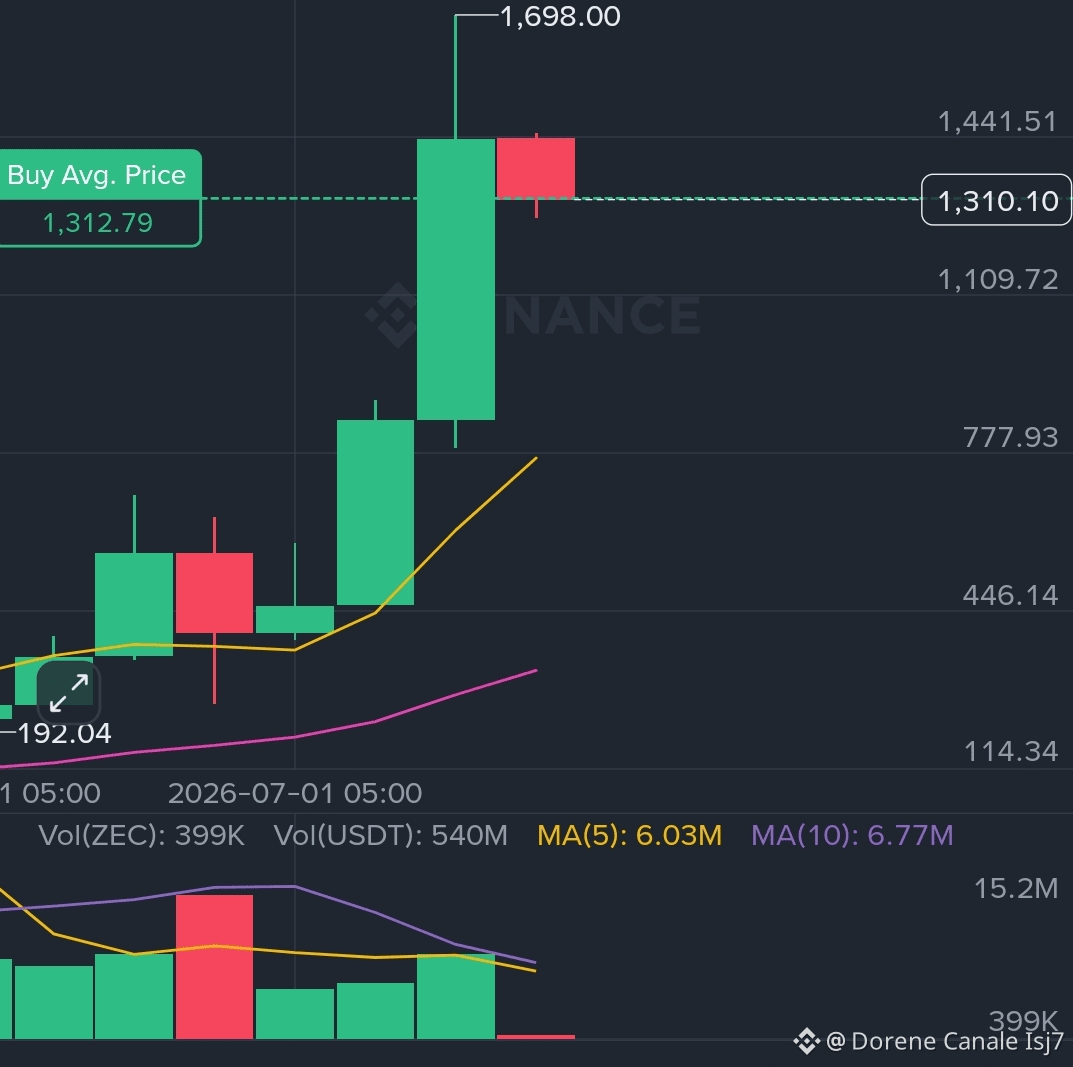
$ZEC The latest red candle shows a pullback from that high, with the price currently trading at 1,310.10 USDT (approx. 362,923.9 PKR). It reflects a cooling-off period after a sharp vertical rally.
Moving Averages: The fast moving average MA(7) sits at 767.62, while MA(25) is at 321.55. The wide gap between the price and the moving averages indicates that the asset has experienced an aggressive macro uptrend, leaving the moving averages far below and creating a potential requirement for a mean-reversion or healthy consolidation.
Performance Context: Despite the recent red candle, #ZECUSDT 's broader performance remains heavily positive on higher timeframes (e.g., +35.84% over 30 days and +185.59% over 90 days).
Profit Taking: The appearance of this red candle right below the 1,698.00 resistance/high suggests that early-stage investors and swing traders are locking in profits, creating immediate selling pressure.
This red candle functions as a local retracement test. Whether bulls can defend the current baseline will determine if this is a minor consolidation structure or the beginning of a deeper correction phase.
$ZEC
#SECProposesCryptoCustodyRules
Moving Averages: The fast moving average MA(7) sits at 767.62, while MA(25) is at 321.55. The wide gap between the price and the moving averages indicates that the asset has experienced an aggressive macro uptrend, leaving the moving averages far below and creating a potential requirement for a mean-reversion or healthy consolidation.
Performance Context: Despite the recent red candle, #ZECUSDT 's broader performance remains heavily positive on higher timeframes (e.g., +35.84% over 30 days and +185.59% over 90 days).
Profit Taking: The appearance of this red candle right below the 1,698.00 resistance/high suggests that early-stage investors and swing traders are locking in profits, creating immediate selling pressure.
This red candle functions as a local retracement test. Whether bulls can defend the current baseline will determine if this is a minor consolidation structure or the beginning of a deeper correction phase.
$ZEC
#SECProposesCryptoCustodyRules