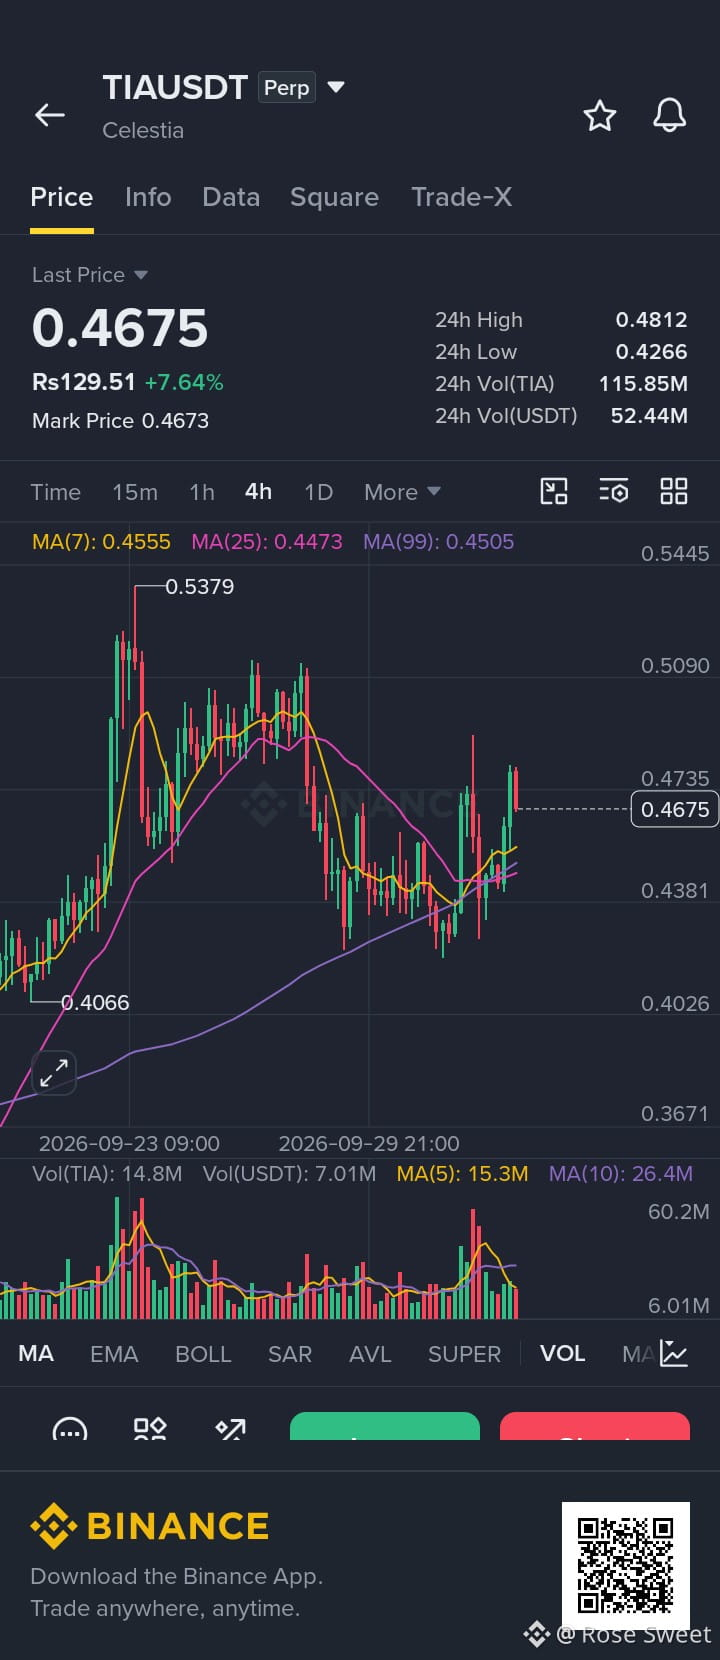
The TIA/USDT chart shows a short-term bullish recovery following a notable decline from its recent peak of 0.5379. The price has reclaimed all major moving averages on the 4-hour chart with strong buying volume support, indicating positive short-term momentum toward the immediate resistance zone near 0.4800 – 0.5000. However, failing to hold above 0.4500 (MA confluence) could signal a return to retest lower support levels.
$TIA
$TRX
$ZEC
#GreekPoliceBustCryptoScamRingArrest17 #FedOctoberRateHikeOddsFallTo17% #CanaryFilesAmendedS1ForPEPEETF
$TIA
$TRX
$ZEC
#GreekPoliceBustCryptoScamRingArrest17 #FedOctoberRateHikeOddsFallTo17% #CanaryFilesAmendedS1ForPEPEETF