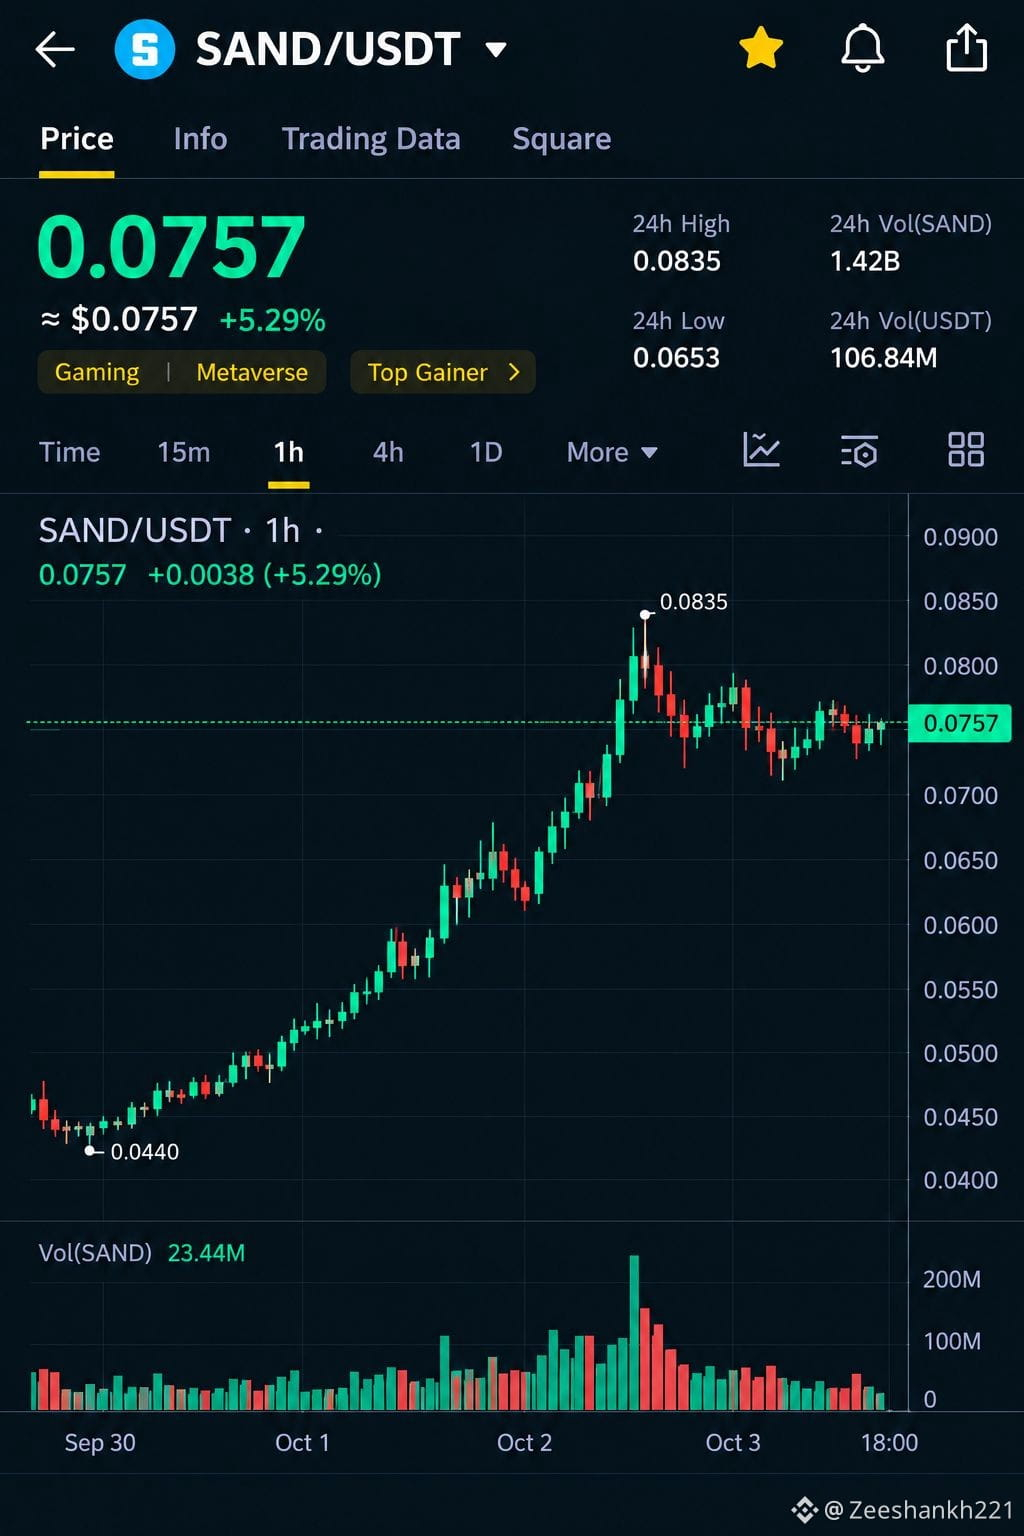
$SAND SAND/USDT Latest Technical Analysis
Current price: ~$0.0757
24h high: ~$0.0835
24h low: ~$0.0653
24h move: about +9.2% on the daily data.
📈 Trend: Bullish, but consolidating
SAND has made a sharp breakout from the ~$0.045 area and reached $0.0835 before pulling back and consolidating around $0.075–$0.080. Recent technical readings remain bullish: the daily moving-average summary shows buy signals across the major MA periods, while RSI is around the low-60s to 70 area depending on the timeframe.
🟢 Key Support
$0.0730–$0.0750 — immediate support $0.0680–$0.0700 — stronger support $0.0630–$0.0650 — major support
🔴 Key Resistance
$0.0800 — immediate resistance $0.0835–$0.0850 — major resistance / recent high $0.0900 — next psychological resistance
🎯 Possible Trading Setup
Potential long zone: $0.0730–$0.0750
Confirmation: 1H close above $0.0800
TP1: $0.0835
TP2: $0.0850
TP3: $0.0900
If SAND loses $0.0730, the next areas to watch are approximately $0.0700 and $0.0650.
The recent move has been accompanied by a large increase in volume, and current technical indicators show strong momentum, but the RSI readings also indicate that the move is becoming extended on some timeframes.
#BitcoinRejectedAt$87K #CerebrasSinksNearly20%OnReportNvidiaToPowerOpenAI #SECProposesCryptoCustodyRules
Current price: ~$0.0757
24h high: ~$0.0835
24h low: ~$0.0653
24h move: about +9.2% on the daily data.
📈 Trend: Bullish, but consolidating
SAND has made a sharp breakout from the ~$0.045 area and reached $0.0835 before pulling back and consolidating around $0.075–$0.080. Recent technical readings remain bullish: the daily moving-average summary shows buy signals across the major MA periods, while RSI is around the low-60s to 70 area depending on the timeframe.
🟢 Key Support
$0.0730–$0.0750 — immediate support $0.0680–$0.0700 — stronger support $0.0630–$0.0650 — major support
🔴 Key Resistance
$0.0800 — immediate resistance $0.0835–$0.0850 — major resistance / recent high $0.0900 — next psychological resistance
🎯 Possible Trading Setup
Potential long zone: $0.0730–$0.0750
Confirmation: 1H close above $0.0800
TP1: $0.0835
TP2: $0.0850
TP3: $0.0900
If SAND loses $0.0730, the next areas to watch are approximately $0.0700 and $0.0650.
The recent move has been accompanied by a large increase in volume, and current technical indicators show strong momentum, but the RSI readings also indicate that the move is becoming extended on some timeframes.
#BitcoinRejectedAt$87K #CerebrasSinksNearly20%OnReportNvidiaToPowerOpenAI #SECProposesCryptoCustodyRules