

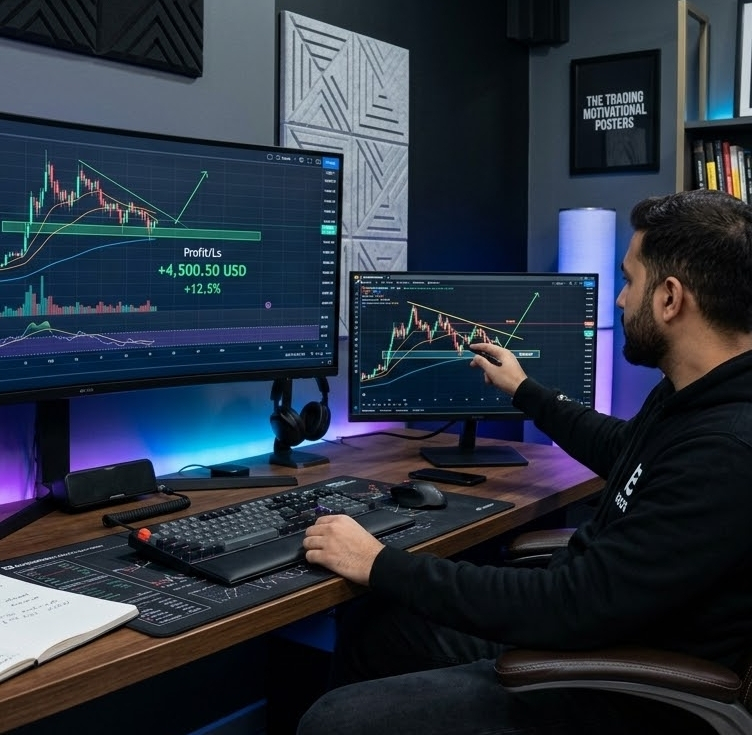
Here is the latest technical and fundamental analysis for Bitcoin $BTC
1. Current Market Overview
Price Range: $84,000 – $85,000 USD
Trend: The short-to-medium-term structure remains Bullish, operating within an ascending price channel.
2. Technical Analysis & Key Levels
Technical LevelPrice ZoneMarket Significance
Immediate Support$81,000 – $82,000Strong buying zone; expect a demand bounce on any short-term pullback.
Major Support$74,000 – $75,000Critical macrotrend-reversal line. A daily close below this signals strong downside pressure.
Immediate Resistance$86,000 – $88,000Key hurdle zone. A clear breakout above this area will trigger rapid upside momentum.
Major Target$90,000 – $95,000Primary expansion zone following a breakout, opening the path toward $100K+.
Indicators:
RSI (Relative Strength Index): Sustained momentum near ~70 indicates solid bullish strength without extreme exhaustion yet.
Moving Averages: BTC continues trading comfortably above its key 20-day, 50-day, and 200-day moving averages.
3. Fundamental & On-Chain Drivers
Institutional Inflows: Continuous net positive inflows into US Spot Bitcoin ETFs are keeping exchange supply tight.
Macroeconomic Setup: Broader market direction remains tied to US Federal Reserve interest rate policies and global liquidity conditions.
On-Chain Sentiment: Profit-taking metrics (such as SOPR) remain in a healthy neutral-to-bullish zone, showing low panic-selling risk.
4. Key Trading Scenarios
Bullish Breakout Scenario:
A daily candle close above $86,000 – $88,000 confirms continuation toward $90,000 and $95,000+.
Dip Buying Scenario:
A temporary retest of the $81,000 – $82,000 support area offers a favorable risk-to-reward entry point (with a tight stop-loss below $79,500).
#BTC #CerebrasSinksNearly20%OnReportNvidiaToPowerOpenAI #SECProposesCryptoCustodyRules #G7PlansToReleaseUpTo100MBarrelsOilDiesel
1. Current Market Overview
Price Range: $84,000 – $85,000 USD
Trend: The short-to-medium-term structure remains Bullish, operating within an ascending price channel.
2. Technical Analysis & Key Levels
Technical LevelPrice ZoneMarket Significance
Immediate Support$81,000 – $82,000Strong buying zone; expect a demand bounce on any short-term pullback.
Major Support$74,000 – $75,000Critical macrotrend-reversal line. A daily close below this signals strong downside pressure.
Immediate Resistance$86,000 – $88,000Key hurdle zone. A clear breakout above this area will trigger rapid upside momentum.
Major Target$90,000 – $95,000Primary expansion zone following a breakout, opening the path toward $100K+.
Indicators:
RSI (Relative Strength Index): Sustained momentum near ~70 indicates solid bullish strength without extreme exhaustion yet.
Moving Averages: BTC continues trading comfortably above its key 20-day, 50-day, and 200-day moving averages.
3. Fundamental & On-Chain Drivers
Institutional Inflows: Continuous net positive inflows into US Spot Bitcoin ETFs are keeping exchange supply tight.
Macroeconomic Setup: Broader market direction remains tied to US Federal Reserve interest rate policies and global liquidity conditions.
On-Chain Sentiment: Profit-taking metrics (such as SOPR) remain in a healthy neutral-to-bullish zone, showing low panic-selling risk.
4. Key Trading Scenarios
Bullish Breakout Scenario:
A daily candle close above $86,000 – $88,000 confirms continuation toward $90,000 and $95,000+.
Dip Buying Scenario:
A temporary retest of the $81,000 – $82,000 support area offers a favorable risk-to-reward entry point (with a tight stop-loss below $79,500).
#BTC #CerebrasSinksNearly20%OnReportNvidiaToPowerOpenAI #SECProposesCryptoCustodyRules #G7PlansToReleaseUpTo100MBarrelsOilDiesel