🐺 $BTC — FROM THE BOTTOM TO HERE
This chart says it all.
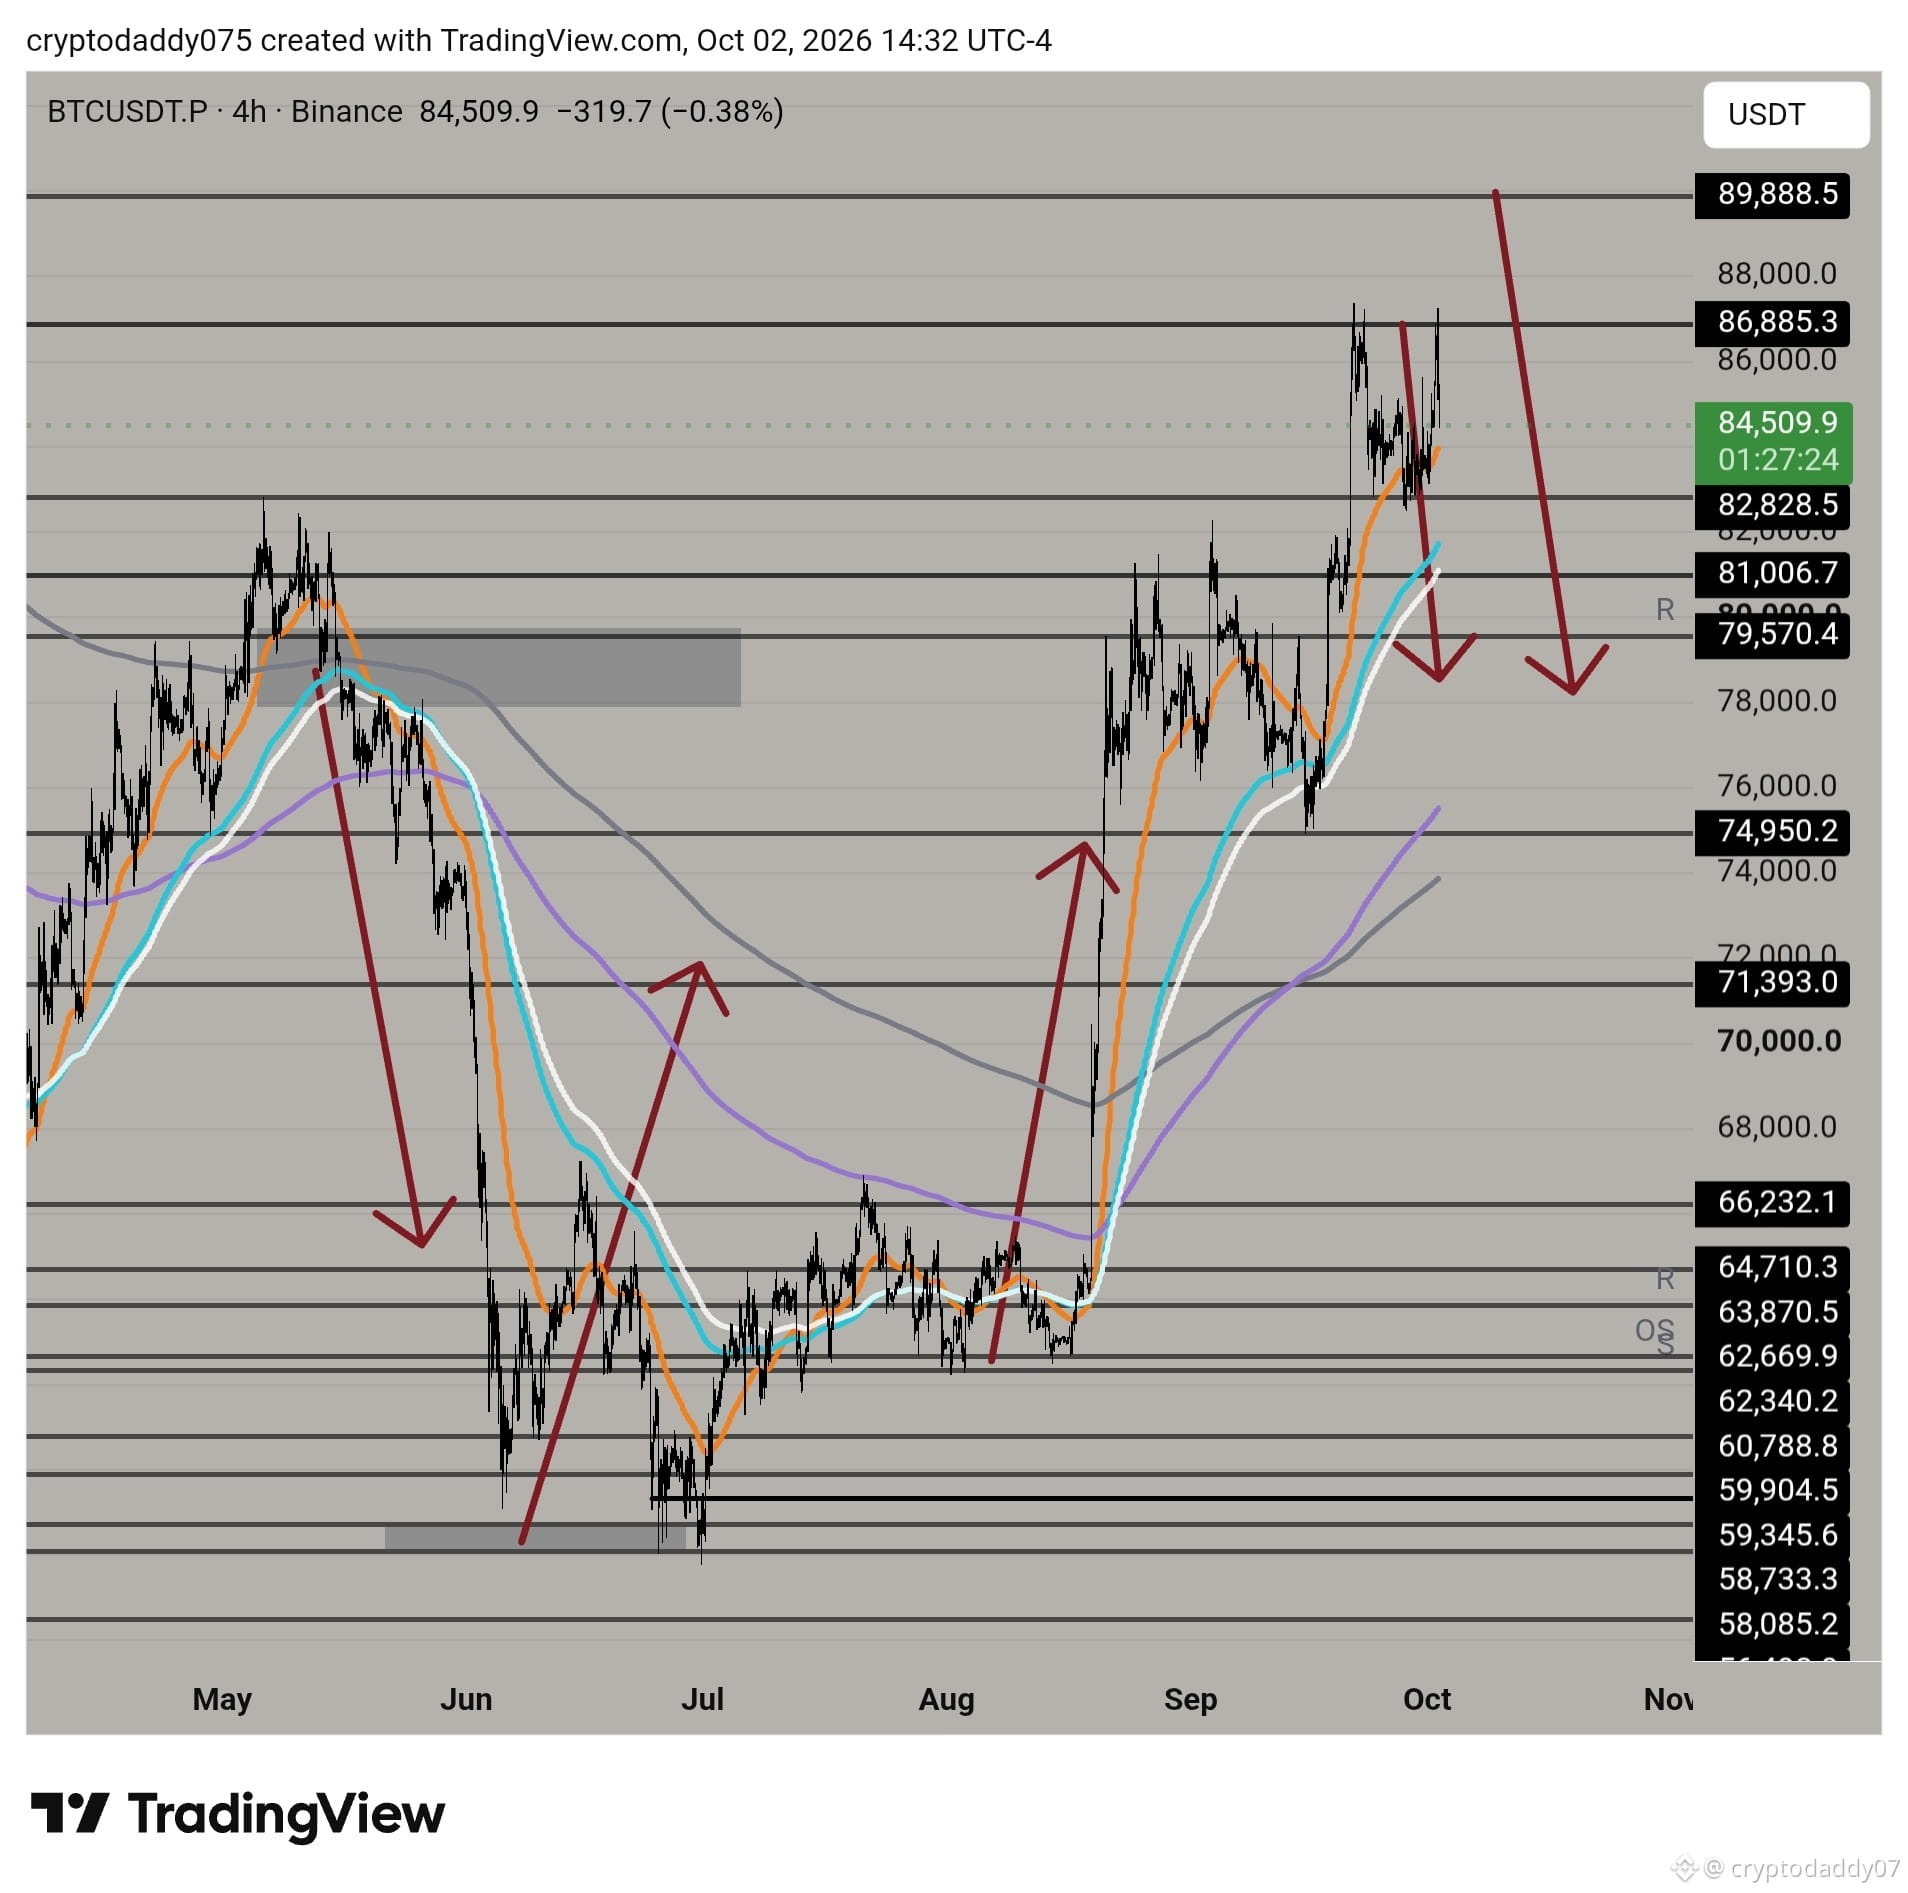
From the $59K–$61K bottom area, the levels I marked kept working step by step:
$62.3K → $63.8K → $64.7K → $66.2K → $71.4K → $75K → $79.5K → $81K → $82.8K → $86.8K
And now we’re here.
The same levels I mapped months ago are still being respected today.
I don’t need to predict every candle.
I mark the levels.
I wait.
Price comes to them.
Then I react.
That’s the whole game. 🐺
No FOMO. No chasing.
Just levels, structure and execution.
This chart says it all.
From the $59K–$61K bottom area, the levels I marked kept working step by step:
$62.3K → $63.8K → $64.7K → $66.2K → $71.4K → $75K → $79.5K → $81K → $82.8K → $86.8K
And now we’re here.
The same levels I mapped months ago are still being respected today.
I don’t need to predict every candle.
I mark the levels.
I wait.
Price comes to them.
Then I react.
That’s the whole game. 🐺
No FOMO. No chasing.
Just levels, structure and execution.