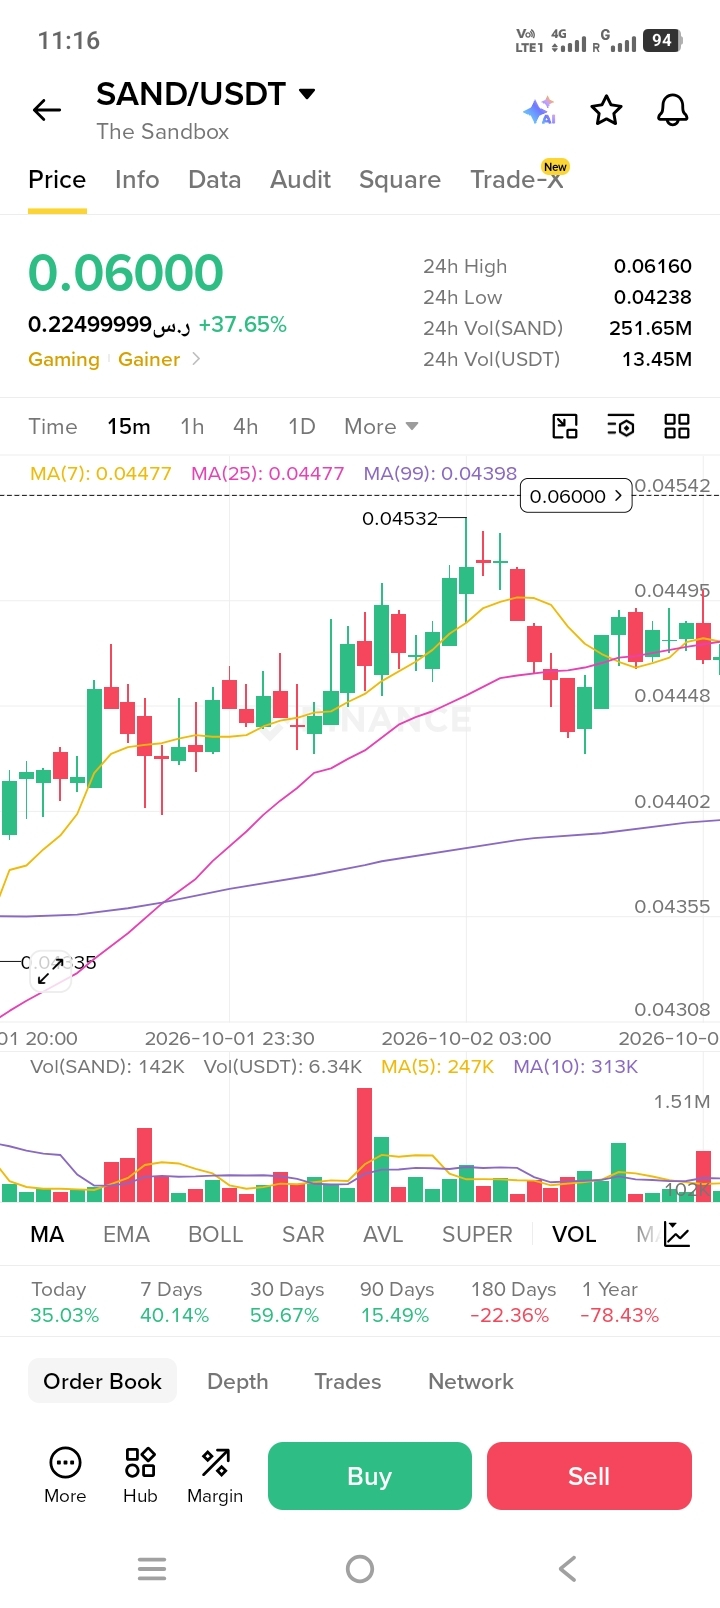
SAND/USDT Chart Analysis (15m Timeframe)
Current Market Metrics
Pair: SAND/USDT (The Sandbox)
Current Price: $0.06000 (Up +37.65% in 24h)
24h High: $0.06160 | 24h Low: $0.04238
24h Volume: 251.65M SAND ($13.45M USDT)
Technical Breakdown
Moving Averages (MA):
MA(7): $0.04477
MA(25): $0.04477
MA(99): $0.04398
Observation: The short-term moving averages (MA7 & MA25) are sloping upwards above the long-term MA99, indicating strong short-term bullish momentum. However, the price at $0.06000 has stretched far above the MAs, signaling potential overbought conditions.
Price Action & Structure:
Price recently broke out heavily from the $0.043–$0.045 region and made a local spike high around $0.06160.
The chart shows higher highs and higher lows on the 15-minute timeframe, confirming a strong impulsive trend. $SAND #technicalJafar #TradingTales
Current Market Metrics
Pair: SAND/USDT (The Sandbox)
Current Price: $0.06000 (Up +37.65% in 24h)
24h High: $0.06160 | 24h Low: $0.04238
24h Volume: 251.65M SAND ($13.45M USDT)
Technical Breakdown
Moving Averages (MA):
MA(7): $0.04477
MA(25): $0.04477
MA(99): $0.04398
Observation: The short-term moving averages (MA7 & MA25) are sloping upwards above the long-term MA99, indicating strong short-term bullish momentum. However, the price at $0.06000 has stretched far above the MAs, signaling potential overbought conditions.
Price Action & Structure:
Price recently broke out heavily from the $0.043–$0.045 region and made a local spike high around $0.06160.
The chart shows higher highs and higher lows on the 15-minute timeframe, confirming a strong impulsive trend. $SAND #technicalJafar #TradingTales