#cryptotradingpro #BTC
🚀 $BTC /USDT: Resistance Breakout and Test of $86,500+! What’s Next?
In recent hours, Bitcoin has staged a powerful breakout from consolidation, clearing local resistance in the $82,000–$84,000 zone and hitting a new high near the $86,800 mark.
Let’s break down the details by timeframe and liquidity clusters:
📊 Timeframe Analysis & Liquidity
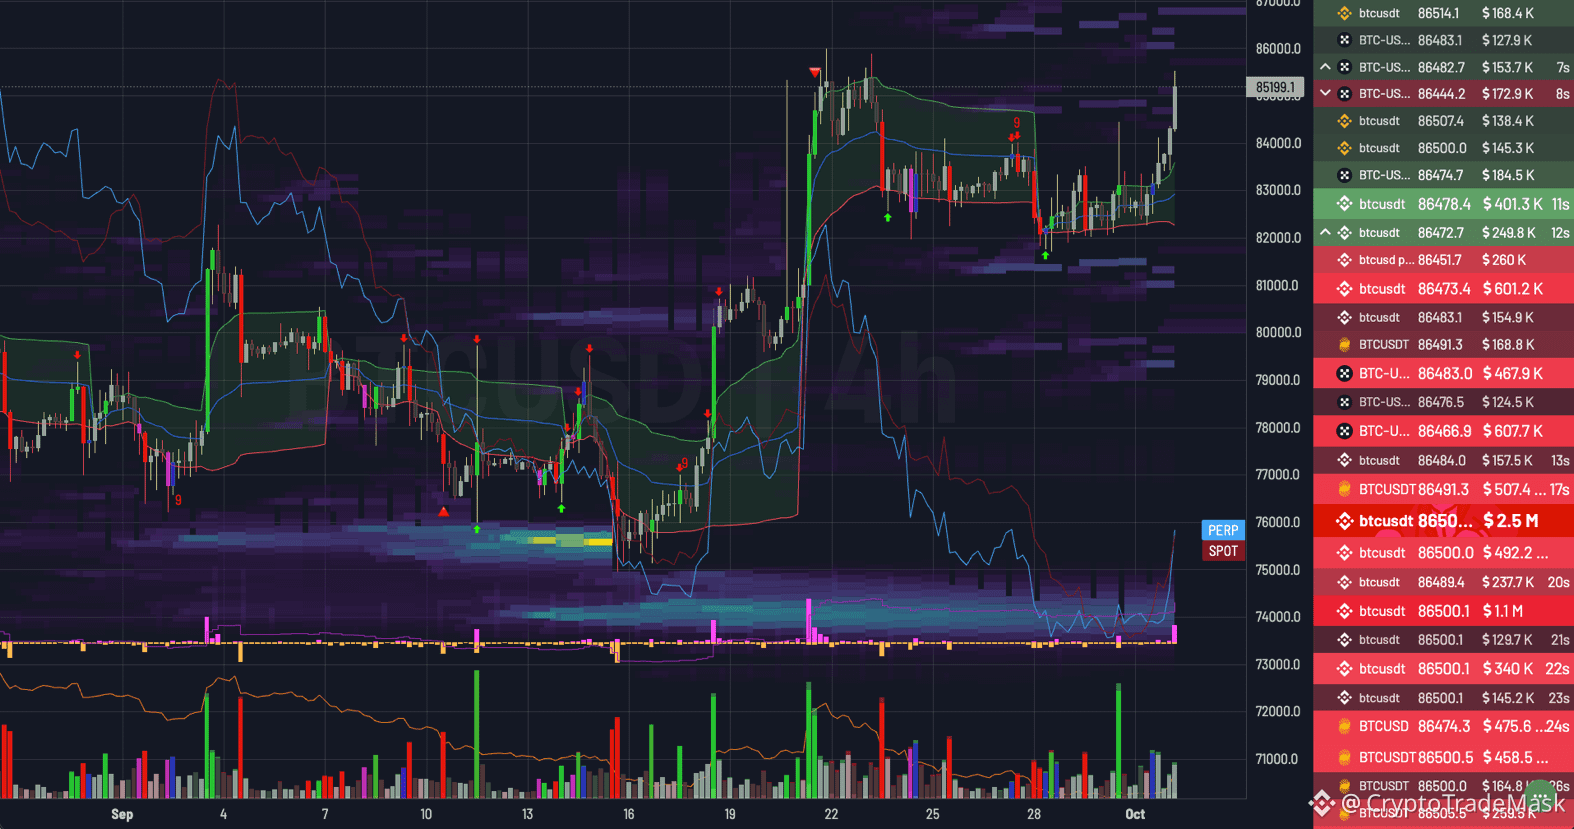
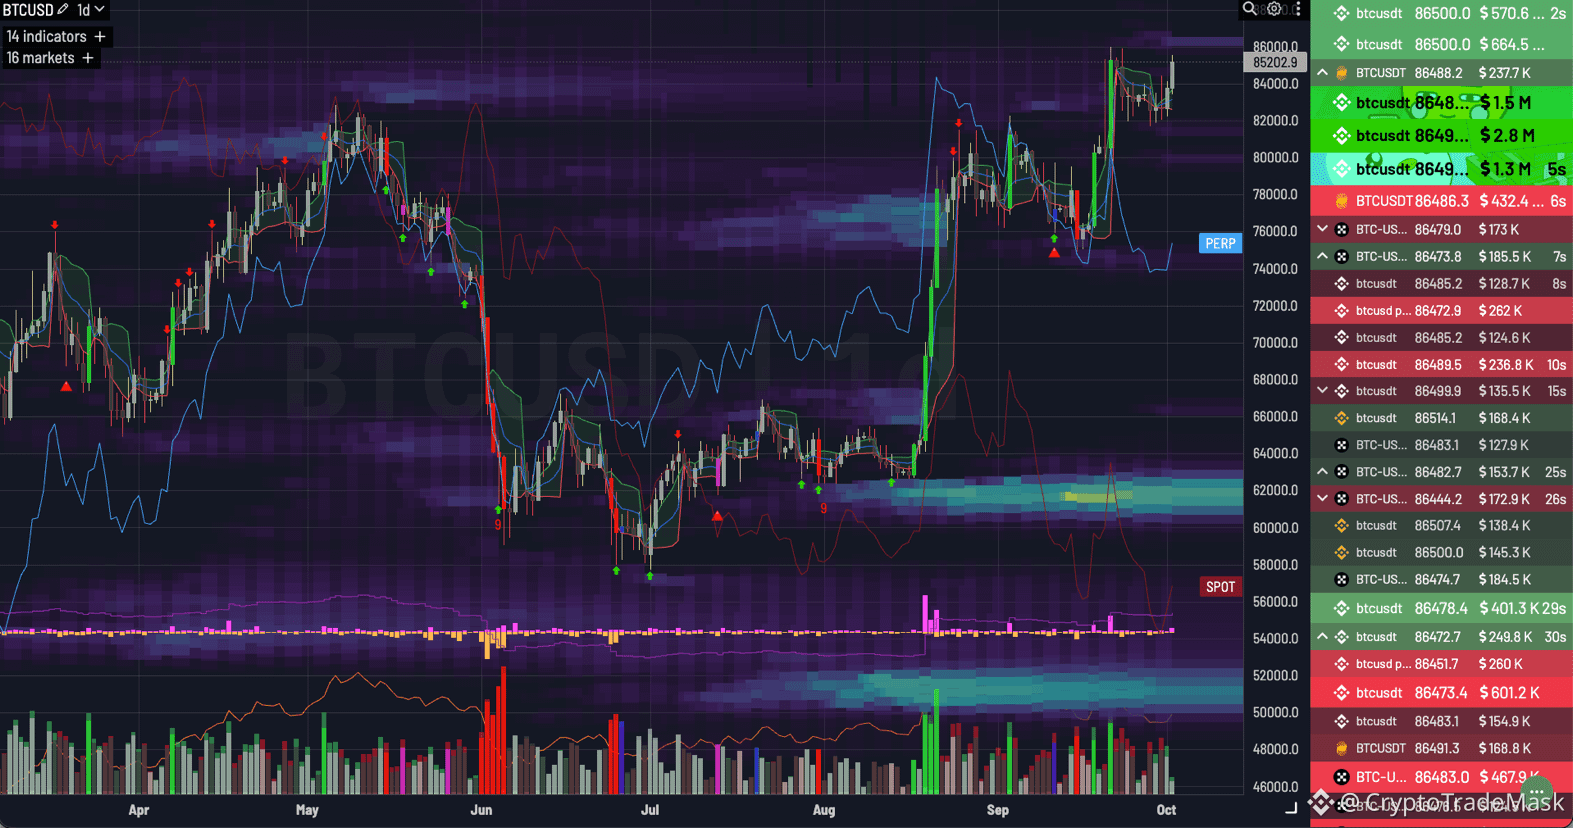
1D / 4H: A clear uptrend on higher timeframes. The range breakout occurred on significant buying volume (Spot & Perp), confirming the presence of a major player.
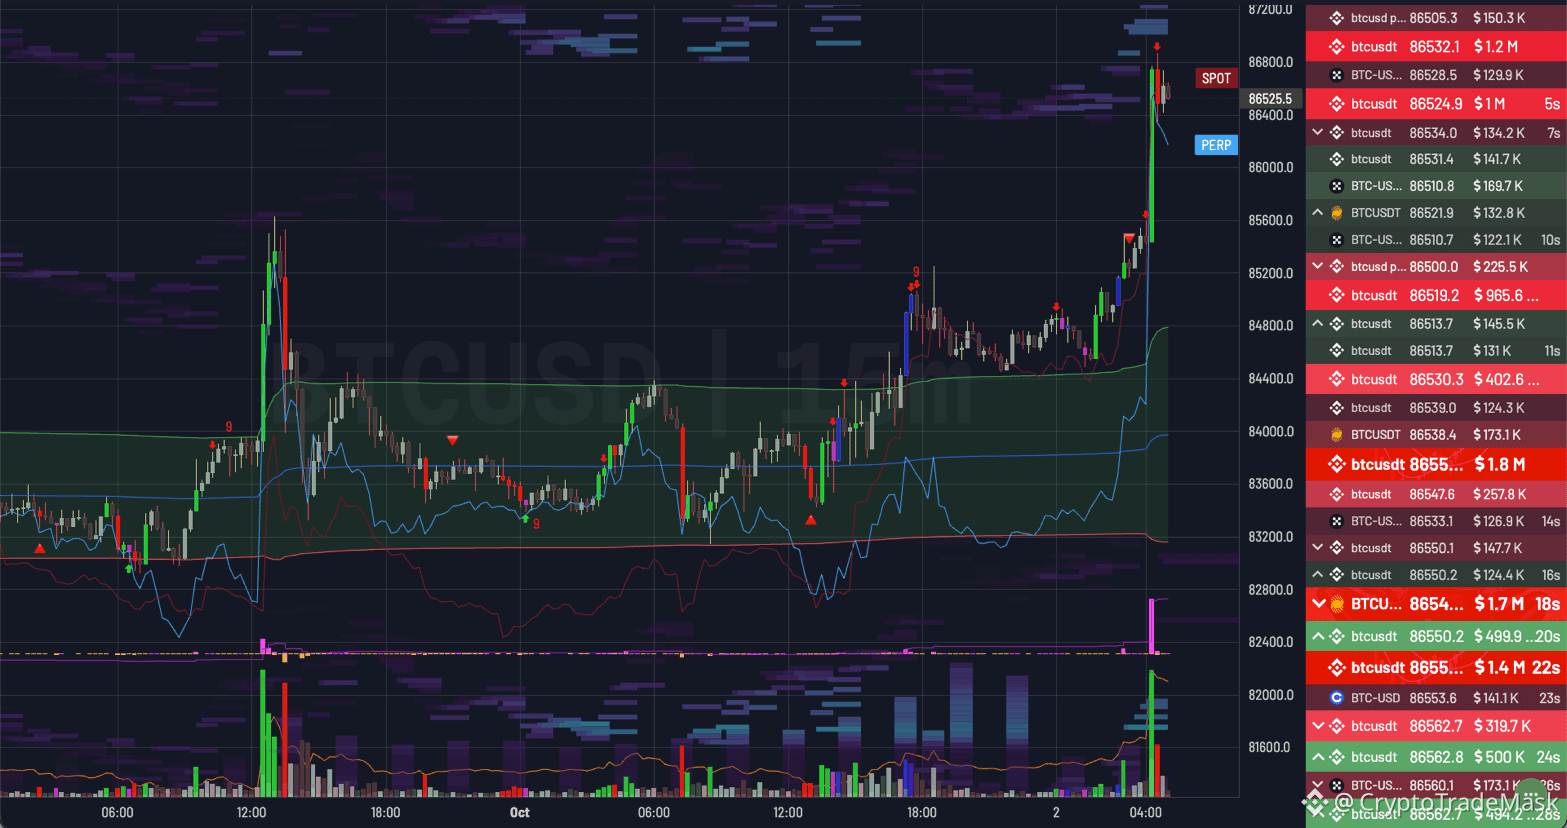
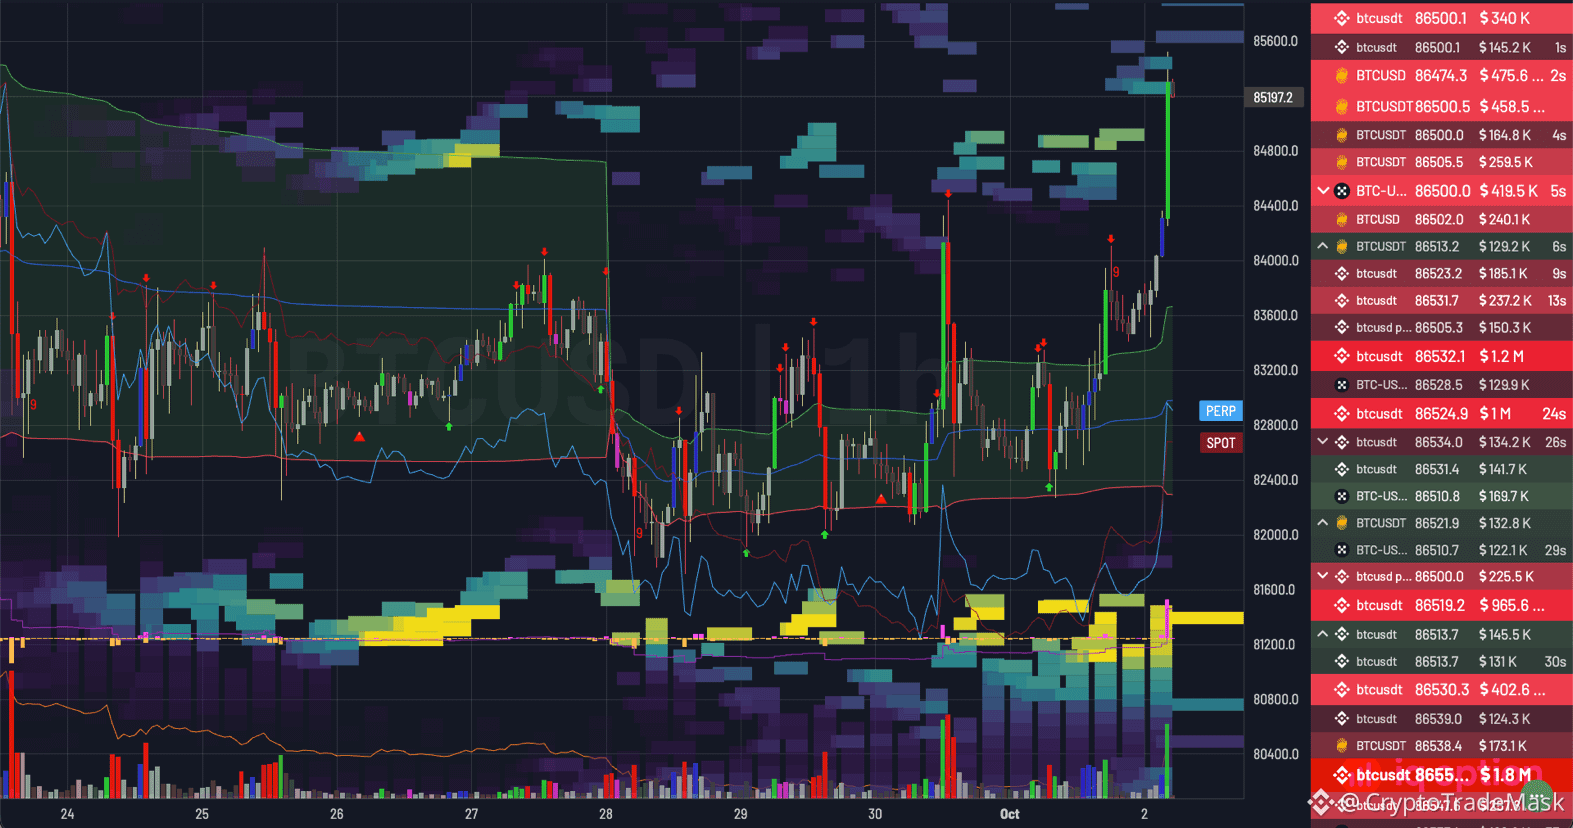
1H / 15M: Vertical momentum is visible on lower timeframes. Initial signs of profit-taking appeared at the $86,800 level, accompanied by a pullback driven by the sweeping of short-seller liquidity.
Heatmap & Order Book: A large volume of limit sell orders is currently concentrated in the $86,500–$87,200 range. The market needs consolidation before moving higher.
🎯 Price Action Scenarios
1️⃣ Primary Scenario (Priority):
A short-term correction or retest of the broken $84,000–$84,800 zone to relieve overbought conditions on the 15M/1H charts. If this level holds, we anticipate another attempt at $86,800, targeting the $88,000–$90,000 range.
2️⃣ Alternative scenario:
A deep drop below $84,000 would indicate a false breakout (fakeout). In that case, the price could pull back to the key support zone of $82,000–$82,800.
⚠️ Summary: The market remains strongly bullish, but opening positions at the peak of the momentum is risky. It is best to look for entry points following the price reaction upon the retest of the $84,000–$84,800 support level.
🚀 $BTC /USDT: Resistance Breakout and Test of $86,500+! What’s Next?
In recent hours, Bitcoin has staged a powerful breakout from consolidation, clearing local resistance in the $82,000–$84,000 zone and hitting a new high near the $86,800 mark.
Let’s break down the details by timeframe and liquidity clusters:
📊 Timeframe Analysis & Liquidity
1D / 4H: A clear uptrend on higher timeframes. The range breakout occurred on significant buying volume (Spot & Perp), confirming the presence of a major player.
1H / 15M: Vertical momentum is visible on lower timeframes. Initial signs of profit-taking appeared at the $86,800 level, accompanied by a pullback driven by the sweeping of short-seller liquidity.
Heatmap & Order Book: A large volume of limit sell orders is currently concentrated in the $86,500–$87,200 range. The market needs consolidation before moving higher.
🎯 Price Action Scenarios
1️⃣ Primary Scenario (Priority):
A short-term correction or retest of the broken $84,000–$84,800 zone to relieve overbought conditions on the 15M/1H charts. If this level holds, we anticipate another attempt at $86,800, targeting the $88,000–$90,000 range.
2️⃣ Alternative scenario:
A deep drop below $84,000 would indicate a false breakout (fakeout). In that case, the price could pull back to the key support zone of $82,000–$82,800.
⚠️ Summary: The market remains strongly bullish, but opening positions at the peak of the momentum is risky. It is best to look for entry points following the price reaction upon the retest of the $84,000–$84,800 support level.