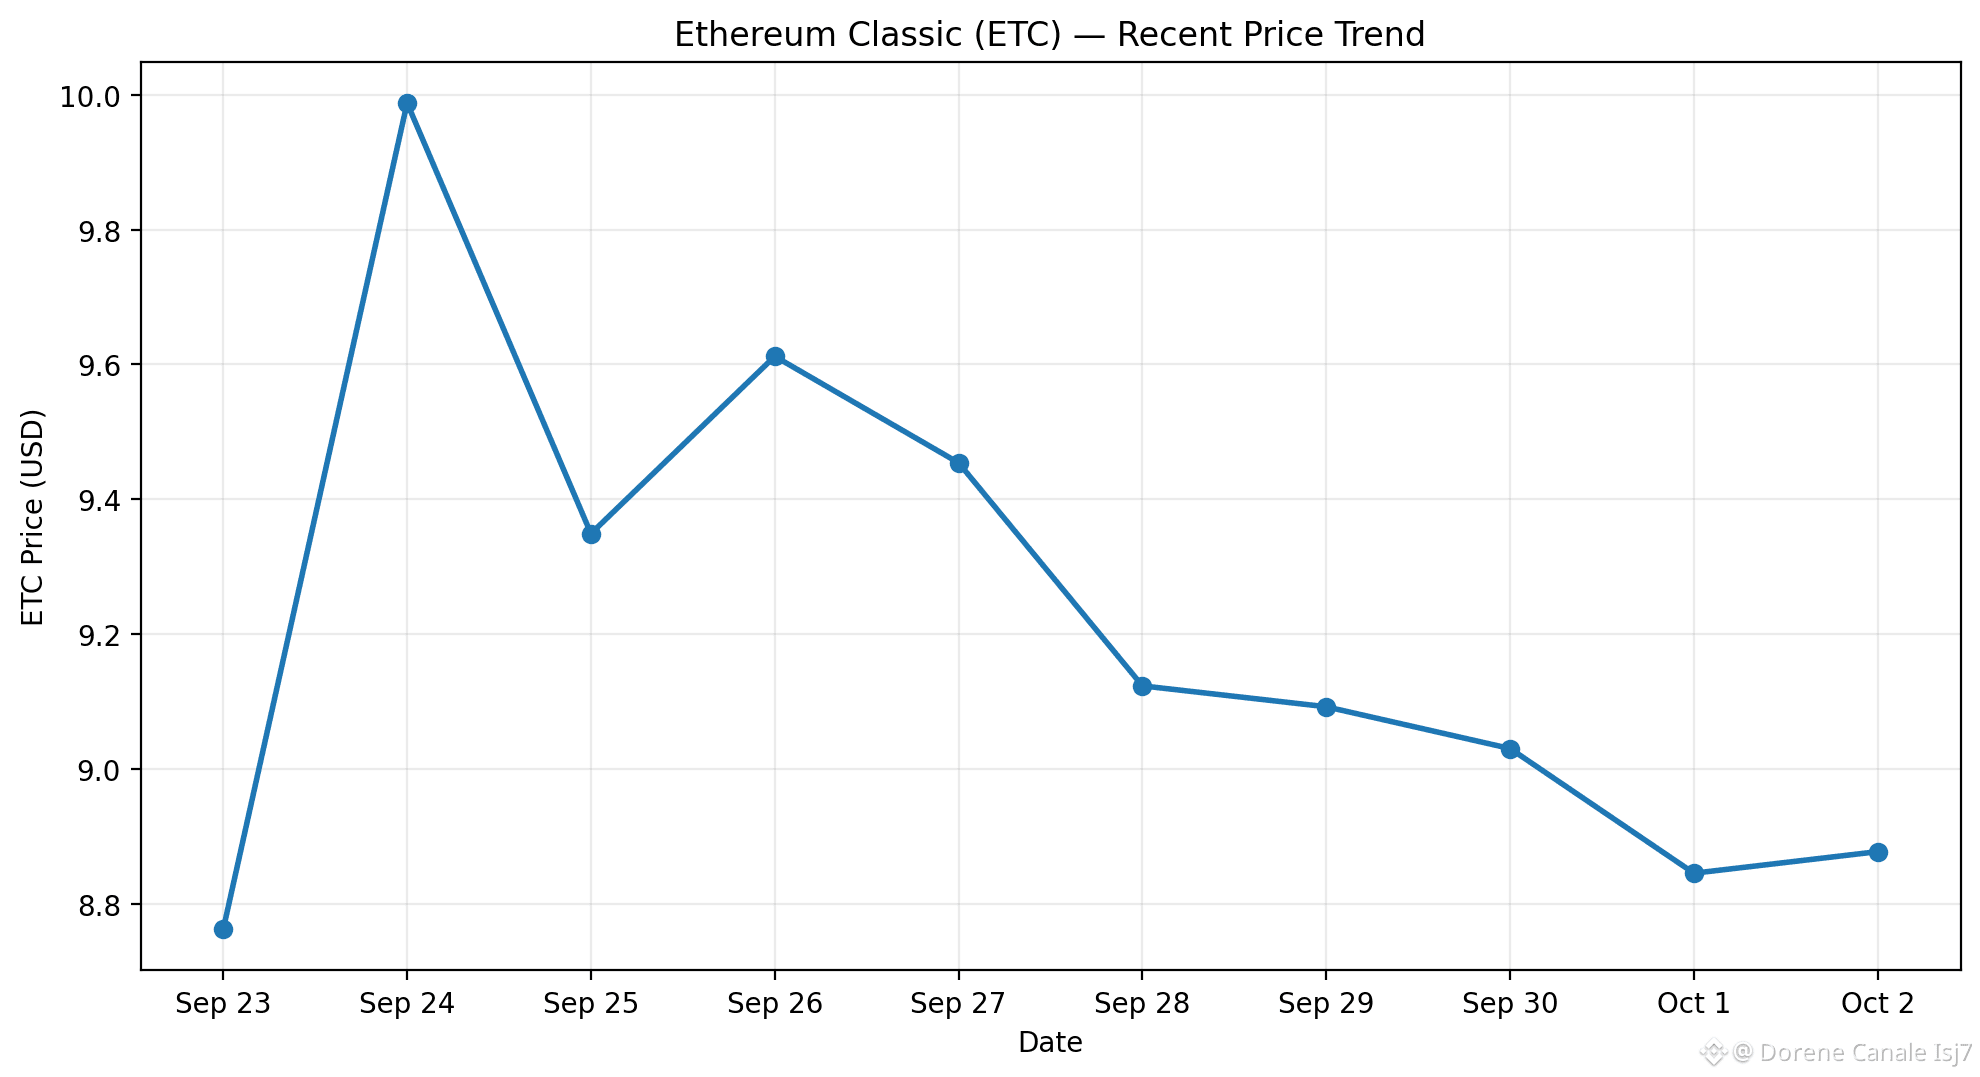
⚡ Latest $ETC Analysis — Oct 2, 2026
$ETC is around $8.8–$8.9. Daily technical indicators remain relatively constructive, while the shorter-term chart is showing some selling pressure.
🟢 Support: $8.50–$8.80
🔴 Resistance: $9.30–$9.70
🚀 Break above $9.70 → $10+ could come into focus
⚠️ Lose $8.50 → downside risk increases
ETC recently experienced a strong rally followed by a correction, so confirmation above resistance is important before expecting another major move.
Short-term view: cautiously bullish above support, but volatile.
$ETC
$ETC is around $8.8–$8.9. Daily technical indicators remain relatively constructive, while the shorter-term chart is showing some selling pressure.
🟢 Support: $8.50–$8.80
🔴 Resistance: $9.30–$9.70
🚀 Break above $9.70 → $10+ could come into focus
⚠️ Lose $8.50 → downside risk increases
ETC recently experienced a strong rally followed by a correction, so confirmation above resistance is important before expecting another major move.
Short-term view: cautiously bullish above support, but volatile.
$ETC