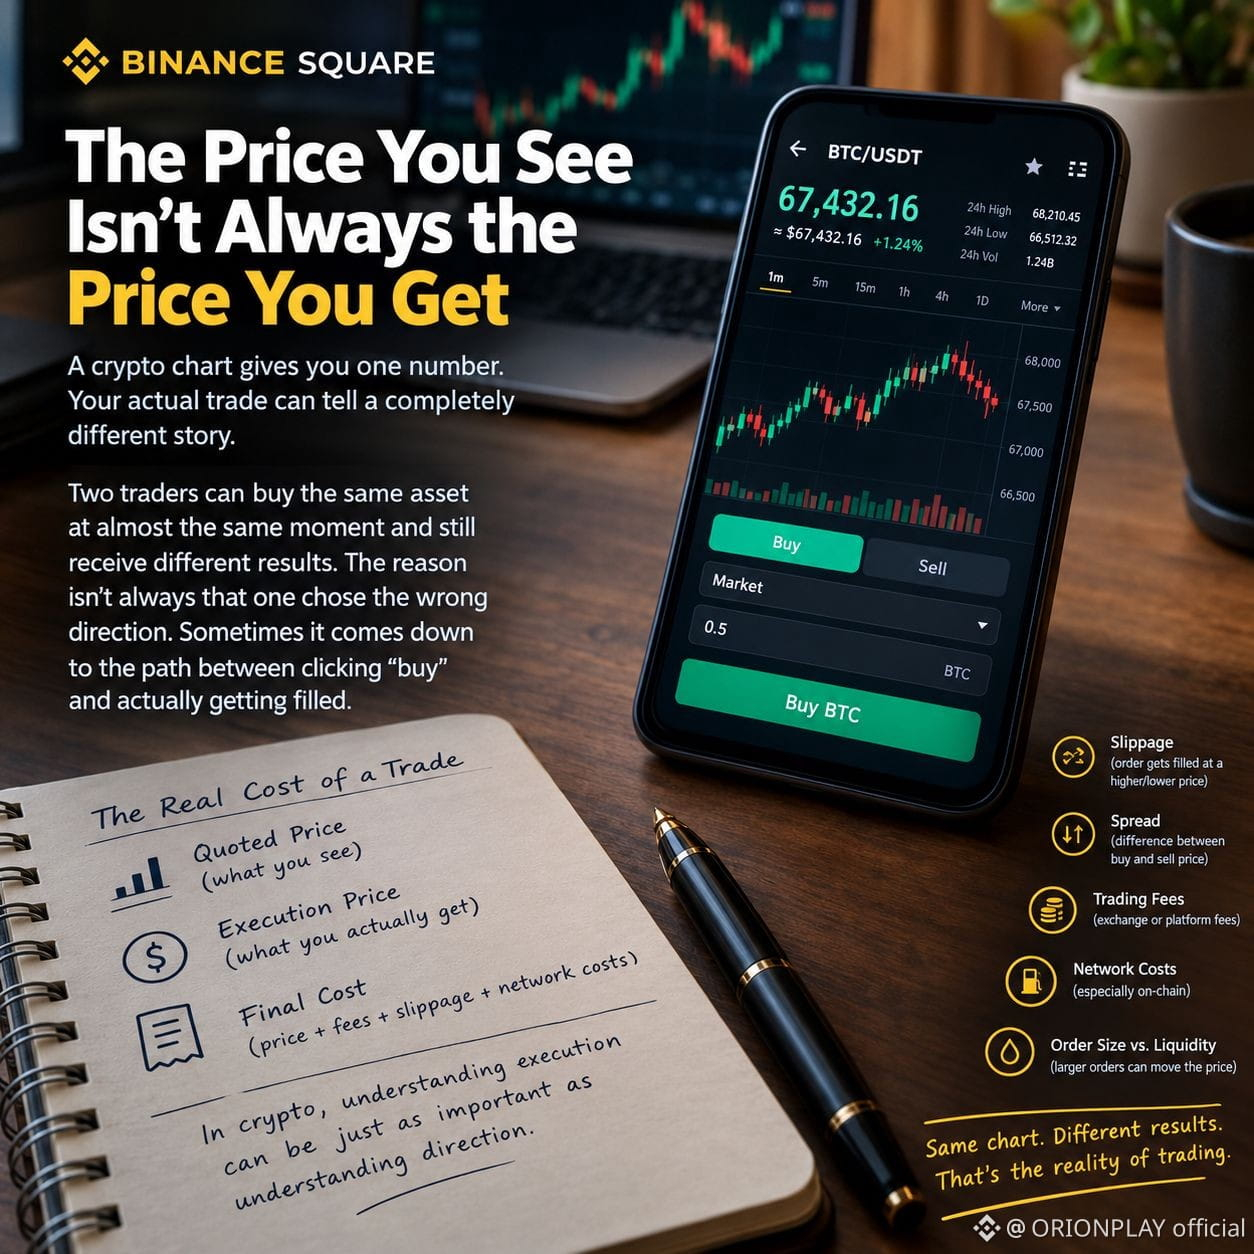
A crypto chart gives you one number.
Your actual trade can tell a completely different story.
Two traders can buy the same asset at almost the same moment and still receive noticeably different results. The reason isn’t always that one chose the wrong direction. Sometimes it comes down to the path between clicking “buy” and actually getting filled.
Consider a simple trade.
You see an asset quoted at $1.00 and place a market order. But the available orders near $1.00 may not be large enough to fill everything at that price. Your remaining order gets matched slightly higher.
That difference is slippage.
Now add the spread between buyers and sellers, trading fees, network costs on-chain, and the size of your order relative to available liquidity. The final execution can look very different from the price displayed on the screen.
This is why a chart alone doesn't describe the complete trading experience.
A useful habit is to separate three questions:
What is the quoted price?
What is the executable price?
What is the final cost?
Those are not necessarily identical.
In crypto, understanding execution can be just as important as understanding direction. A good-looking setup can still produce a poor result if the transaction itself is inefficient.
Sometimes the difference between a good trade and a disappointing one happens after the decision is already made.
#Crypto #Trading #Slippage #MarketMicrostructure #Blockchain #BinanceSquare
Your actual trade can tell a completely different story.
Two traders can buy the same asset at almost the same moment and still receive noticeably different results. The reason isn’t always that one chose the wrong direction. Sometimes it comes down to the path between clicking “buy” and actually getting filled.
Consider a simple trade.
You see an asset quoted at $1.00 and place a market order. But the available orders near $1.00 may not be large enough to fill everything at that price. Your remaining order gets matched slightly higher.
That difference is slippage.
Now add the spread between buyers and sellers, trading fees, network costs on-chain, and the size of your order relative to available liquidity. The final execution can look very different from the price displayed on the screen.
This is why a chart alone doesn't describe the complete trading experience.
A useful habit is to separate three questions:
What is the quoted price?
What is the executable price?
What is the final cost?
Those are not necessarily identical.
In crypto, understanding execution can be just as important as understanding direction. A good-looking setup can still produce a poor result if the transaction itself is inefficient.
Sometimes the difference between a good trade and a disappointing one happens after the decision is already made.
#Crypto #Trading #Slippage #MarketMicrostructure #Blockchain #BinanceSquare