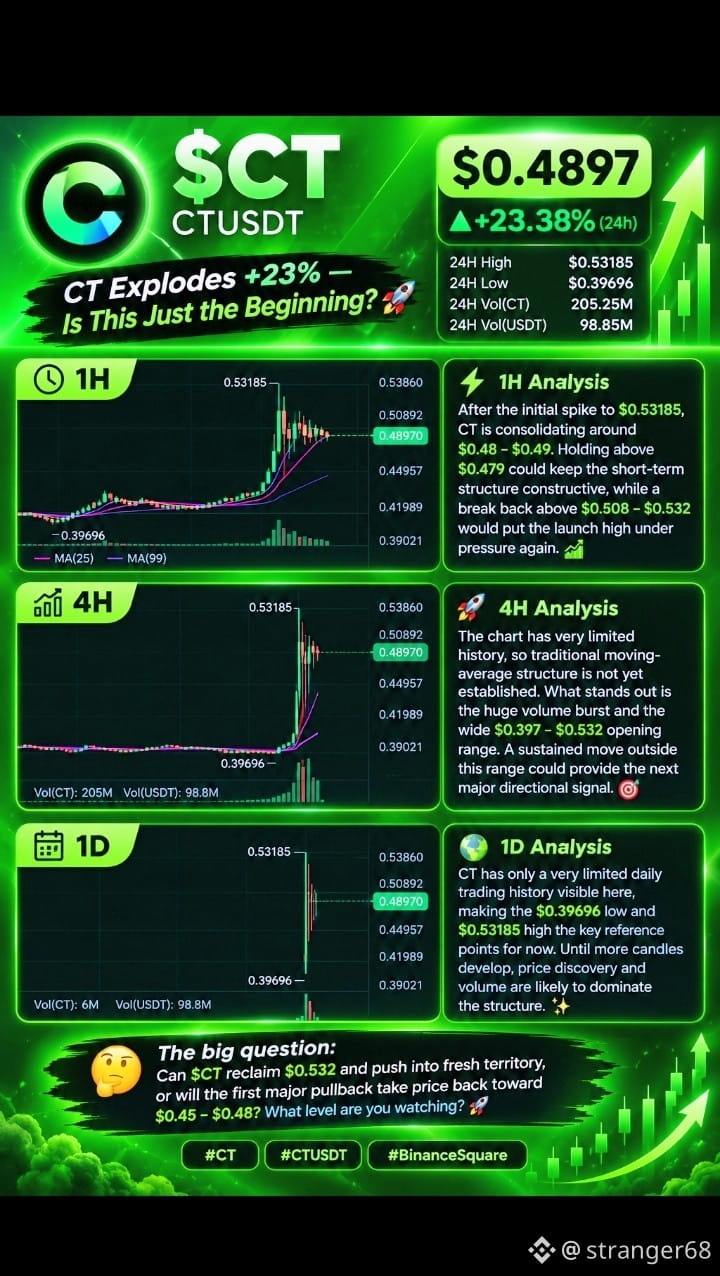
🔥 $CT Explodes +23% — Is This Just the Beginning? ⚡
🚀 CT/USDT is making a powerful first impression, trading around $0.4897 after reaching a 24H high of $0.53185 and a low of $0.39696. Volume has surged above 205M CT, showing intense activity around this fresh market move. 📊
⚔️ 1H: After the initial spike to $0.53185, CT is consolidating around $0.48–$0.49. Holding above $0.479 could keep the short-term structure constructive, while a break back above $0.508–$0.532 would put the launch high under pressure again. 🔥
📈 4H: The chart has very limited history, so traditional moving-average structure is not yet established. What stands out is the huge volume burst and the wide $0.397–$0.532 opening range. A sustained move outside this range could provide the next major directional signal. 🧨
🌍 1D: CT has only a very limited daily trading history visible here, making the $0.39696 low and $0.53185 high the key reference points for now. Until more candles develop, price discovery and volume are likely to dominate the structure. 💫
🎯 The big question: Can $CT reclaim $0.532 and push into fresh territory, or will the first major pullback take price back toward $0.45–$0.48? What level are you watching? 🚀
#CT #CTUSDT #BinanceSquare
#MetaMaskExitsLidoValidatorsAfterSecurityIncident #US10YearYieldNears5.3% #EtherGains70.9%InQ3 #MicronBeatsEarningsLiftsGuidance
🚀 CT/USDT is making a powerful first impression, trading around $0.4897 after reaching a 24H high of $0.53185 and a low of $0.39696. Volume has surged above 205M CT, showing intense activity around this fresh market move. 📊
⚔️ 1H: After the initial spike to $0.53185, CT is consolidating around $0.48–$0.49. Holding above $0.479 could keep the short-term structure constructive, while a break back above $0.508–$0.532 would put the launch high under pressure again. 🔥
📈 4H: The chart has very limited history, so traditional moving-average structure is not yet established. What stands out is the huge volume burst and the wide $0.397–$0.532 opening range. A sustained move outside this range could provide the next major directional signal. 🧨
🌍 1D: CT has only a very limited daily trading history visible here, making the $0.39696 low and $0.53185 high the key reference points for now. Until more candles develop, price discovery and volume are likely to dominate the structure. 💫
🎯 The big question: Can $CT reclaim $0.532 and push into fresh territory, or will the first major pullback take price back toward $0.45–$0.48? What level are you watching? 🚀
#CT #CTUSDT #BinanceSquare
#MetaMaskExitsLidoValidatorsAfterSecurityIncident #US10YearYieldNears5.3% #EtherGains70.9%InQ3 #MicronBeatsEarningsLiftsGuidance