
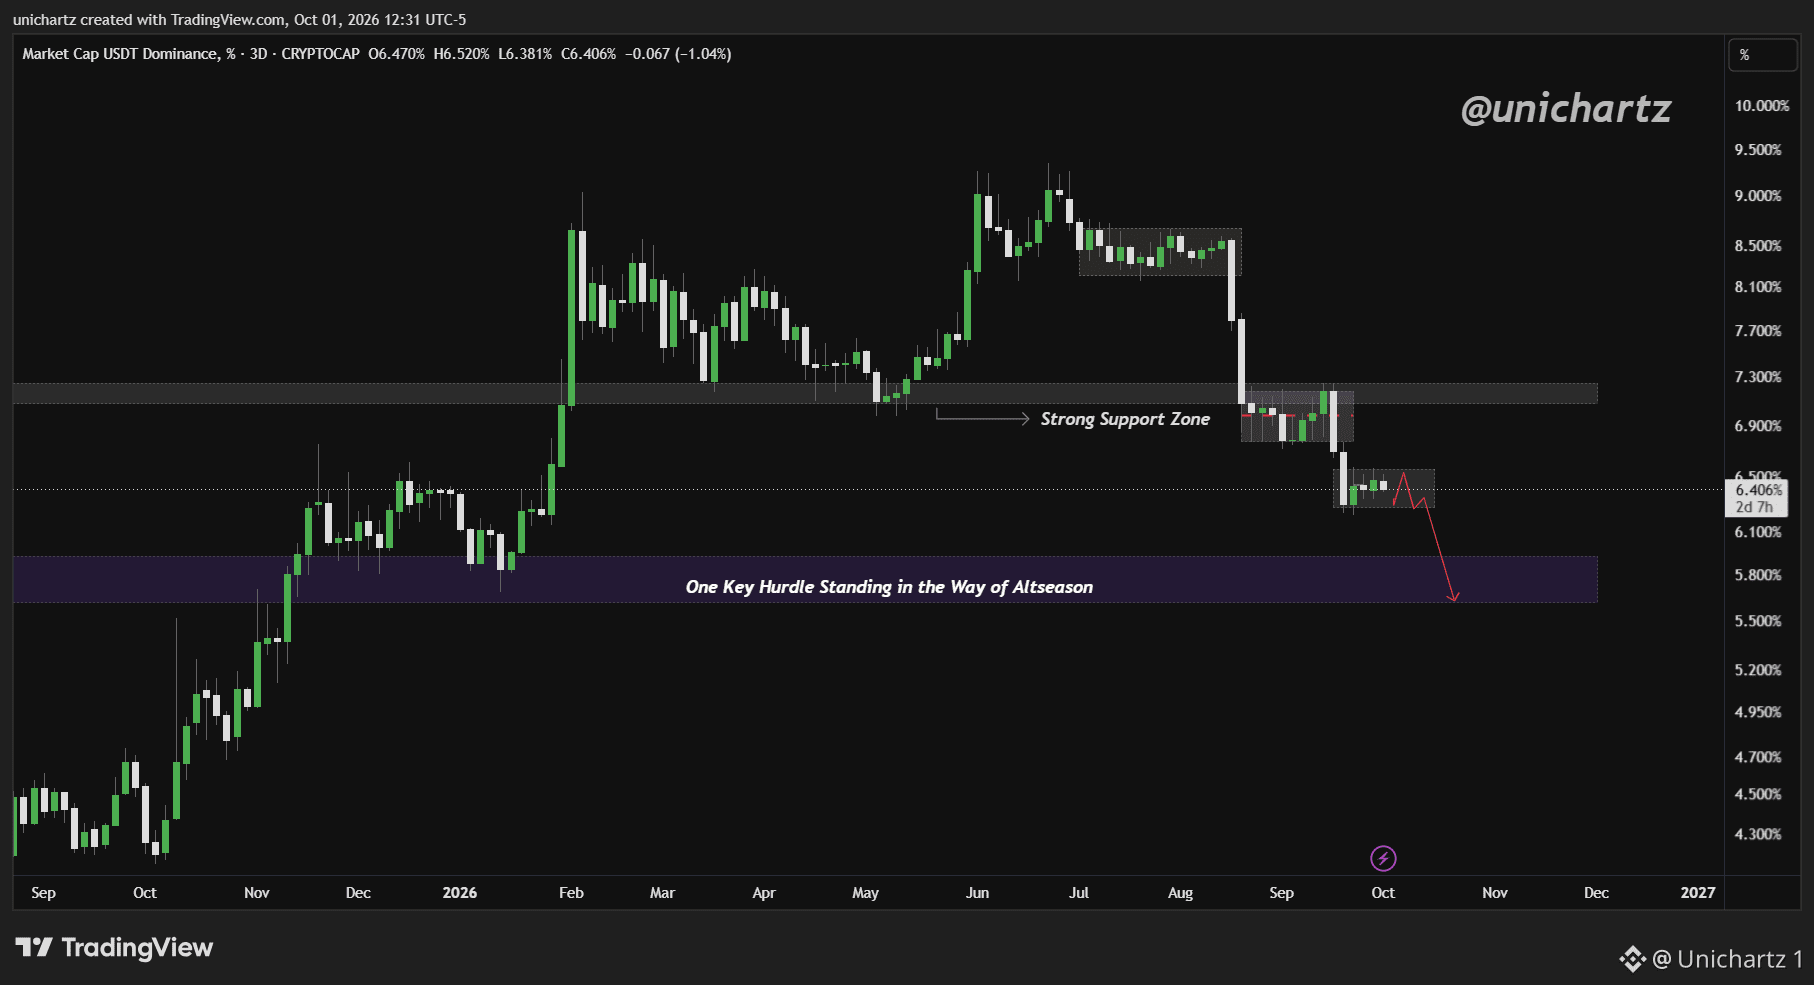
USDT.D 3-Day Analysis This is the chart every altcoin trader needs to have open right now. After peaking near 9% in June and spending months consolidating between 8.5–9%, USDT Dominance has absolutely collapsed, dropping aggressively through the Strong Support Zone at 6.90% and now trading at 6.453%. That is a massive and rapid move. Money is leaving USDT and flowing back into crypto at pace. But here is the most important thing on this entire chart, that purple zone sitting at 5.80–6.10% labeled "One Key Hurdle Standing in the Way of Altseason." That zone is the last wall. Break below it and altseason becomes a very real conversation. Hold above it and USDT.D may stabilize and recover, which would slow altcoin momentum. USDT.D is bleeding and that is bullish for alts. One final zone stands between here and a full altseason confirmation. Watch 5.80% very closely, if that breaks and holds the altcoin market could get very interesting very fast. Thanks for reading, as always. 🙏 If you found this analysis useful, share it with someone who’s watching the altcoin market. Let’s see how this plays out. DYOR, NFA #BTC Price Analysis# #Altcoin Season# #BNBChain# $BTC #Tether


Publier
Avertissement : ce contenu inclut des opinions de tiers. Il ne constitue pas un conseil. Binance Ai peut être utilisée, sans garantie de résultat. Consultez les CG.