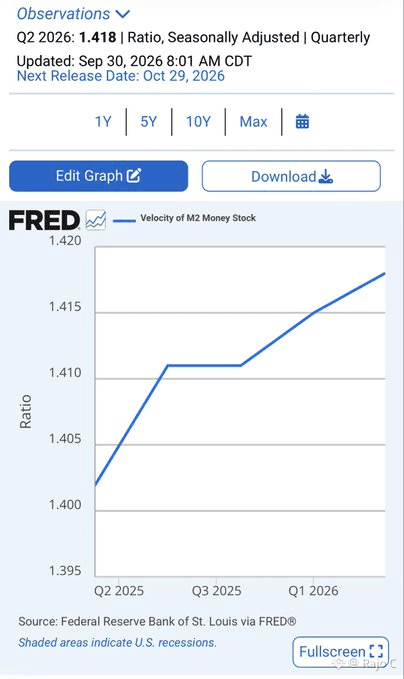
#uscorepceeasesto3%inaugust Here is the latest updated chart of M2 velocity. M2 velocity is simply nominal GDP divided by the amount of money in
the M2 money supply, so it shows how effectively the existing money stock is being turned into economic activity. On September 30, BEA revised Q2 real GDP from 1.5% to 2.2% and nominal GDP from 8.0% to 8.5%. Because nominal GDP is the numerator in the velocity calculation, that mechanically pushed Q2 M2 velocity from 1.415 to 1.418.
It is important to understand that this latest velocity reading is still only Q2 2026, meaning it covers April, May and June. It does not include July, August or September. So this chart is still looking backward at the economy before most of the newer Q3 deterioration, the September Fed hike and the latest energy pressures had time to show up in the data.
The stronger Q2 GDP headline was also not broad based. Much of the revision came from inventories, fixed investment including data center construction, revised consumer spending, updated price estimates and seasonal adjustments. Real estate, information, durable manufacturing and finance provided most of the net growth, while transportation, retail, nondurable manufacturing and mining were already contracting. Q2 was not a weak quarter overall, but growth was becoming increasingly concentrated underneath the headline.
That is why the velocity trend still matters. Even after nominal GDP was revised substantially higher, velocity only crept from 1.415 to 1.418 because M2 itself was expanding almost as quickly. In simple terms, more money was entering the system, but the economy was barely becoming more efficient at turning that larger money supply into additional nominal activity.
The next reading will cover July through September, and if Q3 and especially Q4 show velocity barely moving, flattening or beginning to fall while labor, credit, household income and cyclical industries continue weakening, that would be much stronger evidence that the healthy looking GDP headline is masking a broader loss of economic momentum.$PROMPT $0G $MEW
the M2 money supply, so it shows how effectively the existing money stock is being turned into economic activity. On September 30, BEA revised Q2 real GDP from 1.5% to 2.2% and nominal GDP from 8.0% to 8.5%. Because nominal GDP is the numerator in the velocity calculation, that mechanically pushed Q2 M2 velocity from 1.415 to 1.418.
It is important to understand that this latest velocity reading is still only Q2 2026, meaning it covers April, May and June. It does not include July, August or September. So this chart is still looking backward at the economy before most of the newer Q3 deterioration, the September Fed hike and the latest energy pressures had time to show up in the data.
The stronger Q2 GDP headline was also not broad based. Much of the revision came from inventories, fixed investment including data center construction, revised consumer spending, updated price estimates and seasonal adjustments. Real estate, information, durable manufacturing and finance provided most of the net growth, while transportation, retail, nondurable manufacturing and mining were already contracting. Q2 was not a weak quarter overall, but growth was becoming increasingly concentrated underneath the headline.
That is why the velocity trend still matters. Even after nominal GDP was revised substantially higher, velocity only crept from 1.415 to 1.418 because M2 itself was expanding almost as quickly. In simple terms, more money was entering the system, but the economy was barely becoming more efficient at turning that larger money supply into additional nominal activity.
The next reading will cover July through September, and if Q3 and especially Q4 show velocity barely moving, flattening or beginning to fall while labor, credit, household income and cyclical industries continue weakening, that would be much stronger evidence that the healthy looking GDP headline is masking a broader loss of economic momentum.$PROMPT $0G $MEW