#xrp
Veteran Trader Says No Altseason Without XRP
Veteran trader Cryptollica believes altcoin season is now starting, and xrp will play a consequential role.
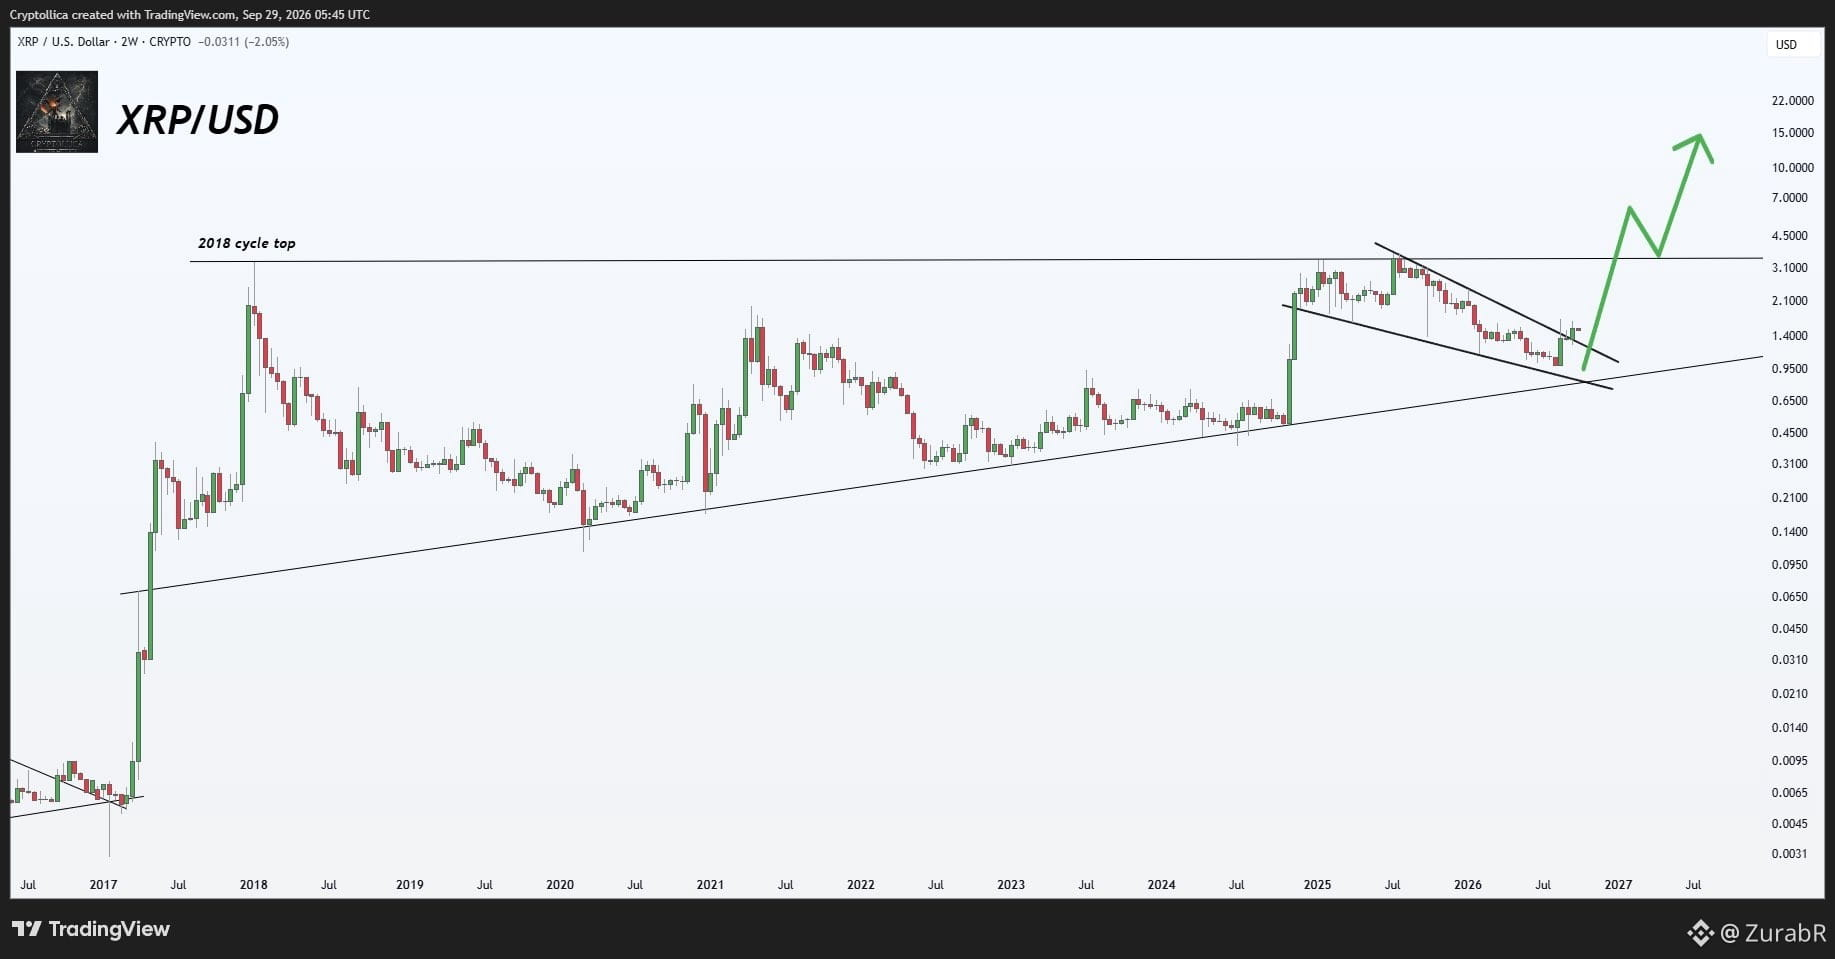
In a post on X, Cryptollica said, “No altseason without $XRP,” and shared a long-term $XRP /USD chart showing $XRP ’s price pattern from 2017 and foreshadowing a possible pattern for 2027.
$XRP Is in a Long-Term Price Pattern
Cryptollica’s two-week $XRP/USD chart shows xrp moving within a downward trend that started after the token reached around $3.60 in 2025
The $3.60 level was also close to $XRP’s 2018 peak and remains a major resistance level. After reaching its 2025 high, xrp began making lower highs and lower lows. The downward trendline is now moving toward the $1 to $1.40 area, where xrp has recently been trading.
At the same time, a long-term support line connects $XRP’s major lows from previous market cycles. Together, these two trendlines are creating a narrowing range and setting up the possibility of a breakout.
Bold Price Target
The most important part of the chart is the green projected path. According to the chart, xrp could first break out of its current downtrend and rise toward the $3 resistance area.
From there, the projection shows xrp climbing to around $7, then falling back toward $4.50 before rising again. The final target on the chart is around $15, which would represent roughly a 10x increase from current levels.
Notably, xrp has experienced impressive price action recently. It was around $1.24 on September 16 before rising to about $1.66 on September 23. By September 30, it was trading near $1.50. #Write2Earn #EarningsSeason $XRP
Veteran Trader Says No Altseason Without XRP
Veteran trader Cryptollica believes altcoin season is now starting, and xrp will play a consequential role.
In a post on X, Cryptollica said, “No altseason without $XRP,” and shared a long-term $XRP /USD chart showing $XRP ’s price pattern from 2017 and foreshadowing a possible pattern for 2027.
$XRP Is in a Long-Term Price Pattern
Cryptollica’s two-week $XRP/USD chart shows xrp moving within a downward trend that started after the token reached around $3.60 in 2025
The $3.60 level was also close to $XRP’s 2018 peak and remains a major resistance level. After reaching its 2025 high, xrp began making lower highs and lower lows. The downward trendline is now moving toward the $1 to $1.40 area, where xrp has recently been trading.
At the same time, a long-term support line connects $XRP’s major lows from previous market cycles. Together, these two trendlines are creating a narrowing range and setting up the possibility of a breakout.
Bold Price Target
The most important part of the chart is the green projected path. According to the chart, xrp could first break out of its current downtrend and rise toward the $3 resistance area.
From there, the projection shows xrp climbing to around $7, then falling back toward $4.50 before rising again. The final target on the chart is around $15, which would represent roughly a 10x increase from current levels.
Notably, xrp has experienced impressive price action recently. It was around $1.24 on September 16 before rising to about $1.66 on September 23. By September 30, it was trading near $1.50. #Write2Earn #EarningsSeason $XRP