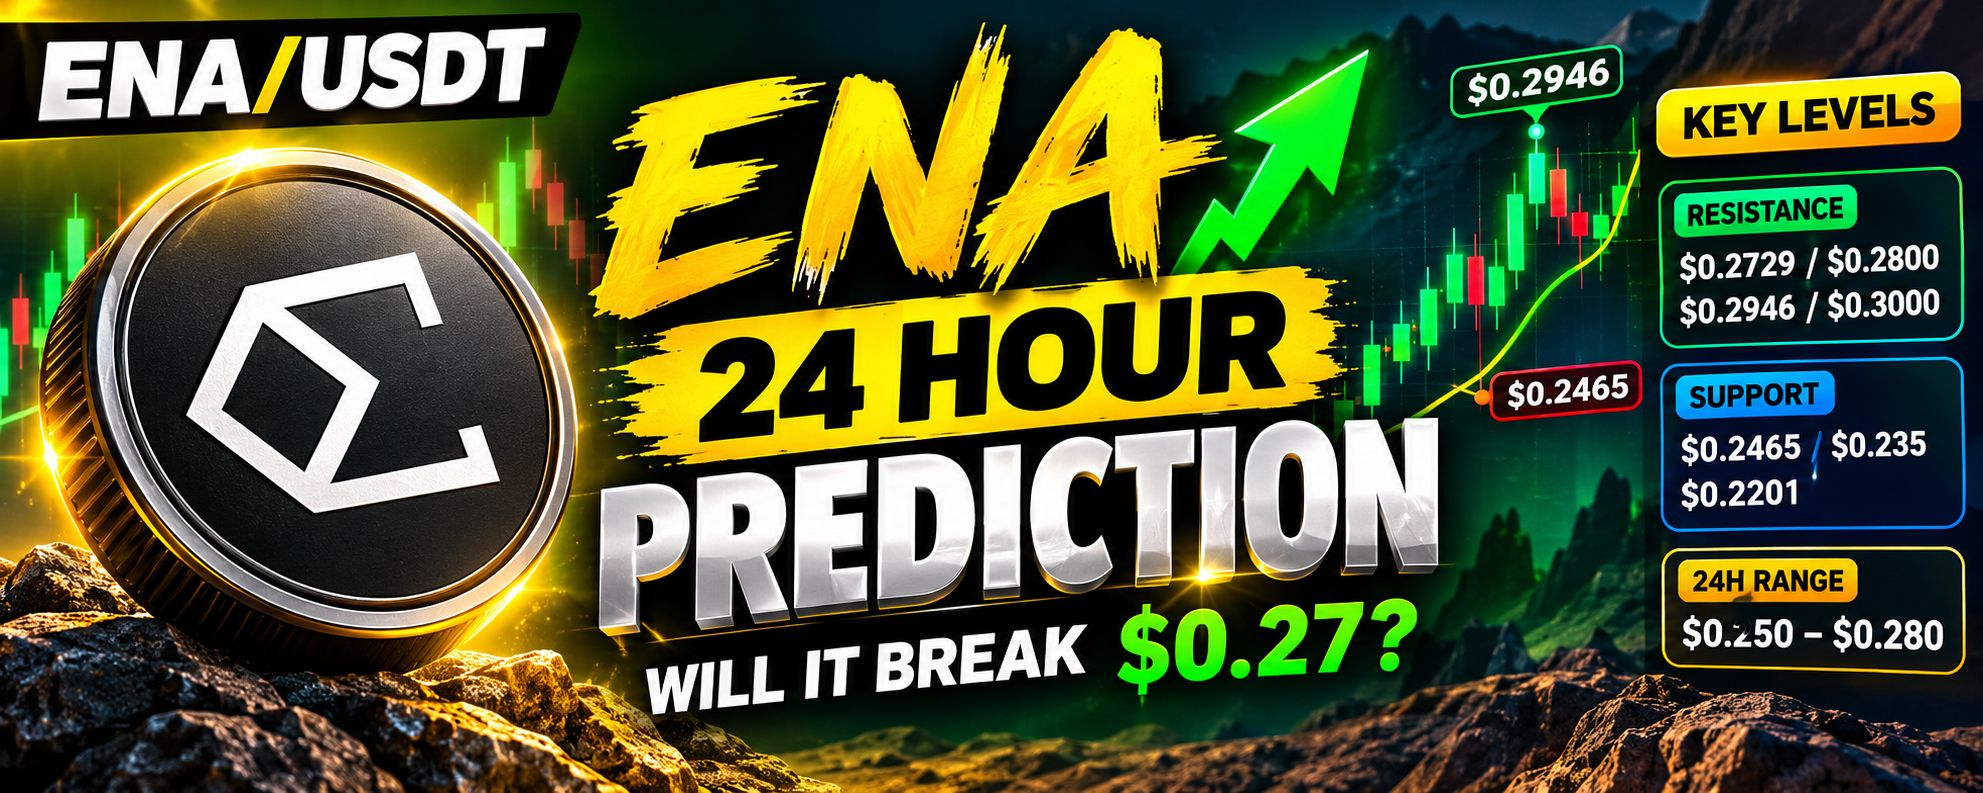

Ethena ($ENA /USDT) is showing a short-term recovery setup after a strong September rally. In the screenshots, ENA is trading around $0.2617, with the 4-hour chart showing price above the MA(7) at $0.2513 but almost exactly at the MA(25) around $0.2621.
Recent market data also shows elevated volatility: ENA reached approximately $0.2944–$0.2946 during the recent rally before pulling back.
Investing.com Canada +1
24-hour technical outlook
🟢 Bullish scenario
The first important resistance is around $0.2729. If ENA closes convincingly above this level on the 4-hour chart with increasing volume, the next areas to watch are:
$0.2800
$0.2946
$0.3000–$0.3040
A move above $0.2946 would be particularly significant because that is the recent swing high visible on the chart.
The order-book snapshot in your screenshot also shows approximately 65% buy-side vs. 35% sell-side, although order-book percentages can change very quickly and shouldn't be treated as a standalone signal.
🟡 Neutral/base scenario
If ENA remains between roughly $0.25 and $0.273, the most likely short-term behavior from the chart would be sideways consolidation with volatility.
The $0.257–$0.262 region is important because it contains the daily MA(7) at $0.2573 and the 4-hour MA(25) near $0.2621.
A reasonable 24-hour trading range based on the chart structure is approximately:
$0.250–$0.280
🔴 Bearish scenario
The first major support is around $0.2465 on the 4-hour chart. If that level breaks decisively, ENA could move toward:
$0.235 → $0.220
The $0.2201 region is the next major chart support visible in your screenshot. A break below it would significantly weaken the current short-term recovery structure.
What could affect ENA over the next 24 hours?
#ethena has had several important developments recently. Reports indicate that Ethena expanded USDe's backing strategy into tokenized equities and equity perpetuals, while its USDe incentive program is also ending.
Startup Fortune +1
There has also been reported whale accumulation, with one address purchasing roughly 38 million ENA across recent transactions.
TokenPost
These developments can increase attention and volatility, but they do not guarantee that ENA will rise over the next 24 hours.
My 24-hour chart-based estimate
Based only on the technical structure shown in your screenshots, I would use these levels:
Scenario
ENA price area
Strong bullish breakout
$0.280–$0.295
Base/consolidation
$0.250–$0.275
Strong bearish move
$0.235–$0.246
Major support
~$0.220
Key level to watch: $0.273.
Above $0.273, momentum could attempt a retest of $0.2946. Below $0.2465, the short-term structure becomes considerably weaker.