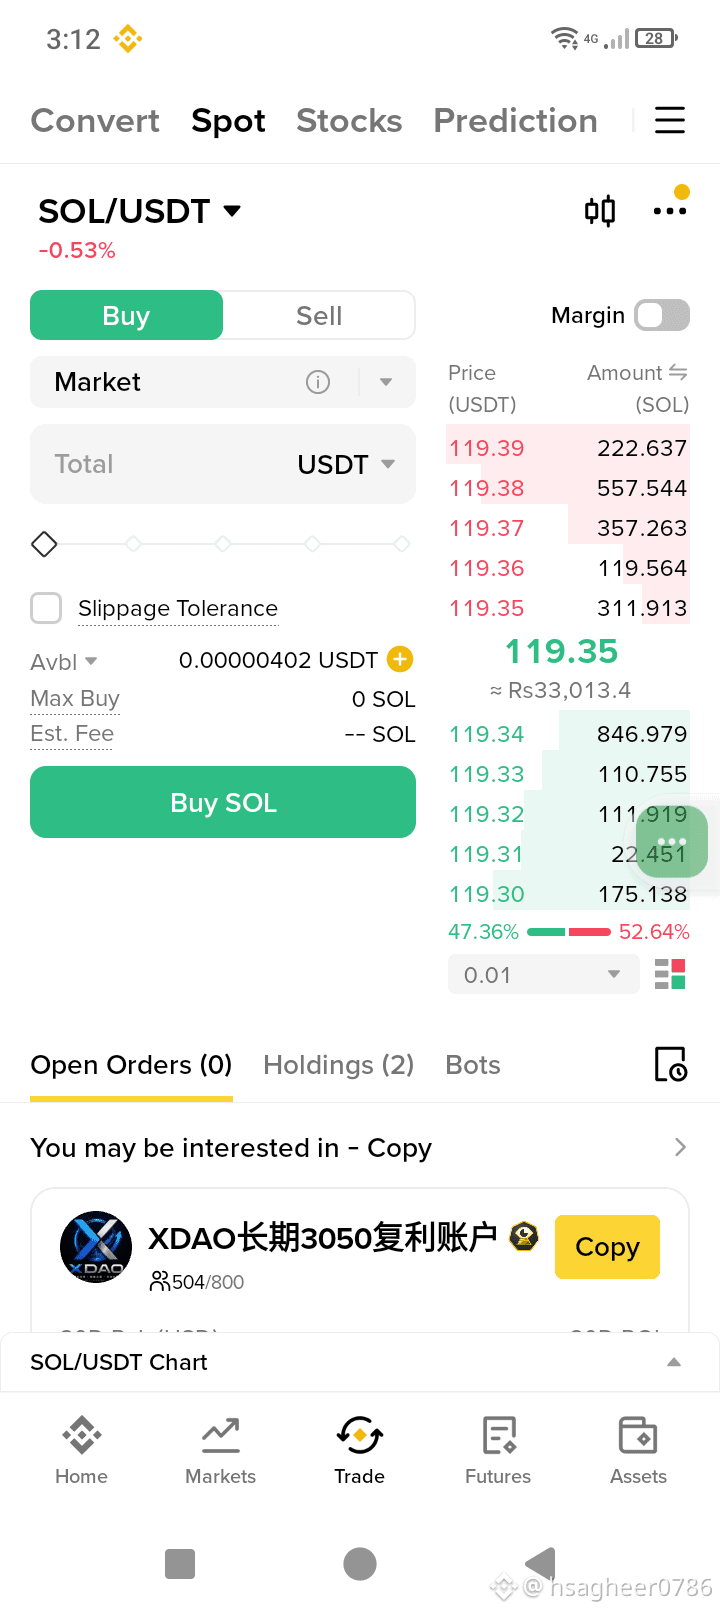
Here is a complete, action-oriented technical breakdown and social media post for Solana (SOL) today.
☀️ Solana (SOL) Technical Analysis & Trading Framework
Solana is currently consolidating in the $116 – $120 range. After testing upper boundary resistance, short-term momentum has flattened, but SOL continues to hold a constructive daily higher-low structure. Traders are watching key range boundaries closely to capitalize on the next expansion phase.
📊 Key Technical Levels to Watch
ZonePrice RangeTechnical ContextOverhead Resistance$120 – $123Crucial resistance barrier; a daily close above this unlocks targets near $125–$130.Key Demand Floor$113 – $116Core short-term support and 4H EMA cluster.Macro InvalidationBelow $96Losing $95–$96 breaks the daily bullish trend structure.
💡 Execution Framework & Trade Setups
1. Breakout & Retest (Momentum Long)
Trigger: Wait for a 4-hour candle close strictly above $120 accompanied by rising On-Balance Volume (OBV).
Targets: $125 / $130.
Stop Loss: Below $117.50.
2. Support Liquidity Sweep (Range Long)
Trigger: Look for an intraday wick into $113 – $116 followed by a 1-hour bullish reversal candle or RSI bullish divergence.
Targets: $120 / $123.
Stop Loss: Below $111.50.
⚙️ Solana-Specific Trading Tips
Watch Ecosystem Volume & On-Chain DEX Flows: Solana price momentum often leads or coincides with spikes in Raydium/Orca DEX volume and meme token liquidity. Surging on-chain activity frequently signals institutional and retail buying before spot order books move.
Monitor SOL/ETH Performance: Track relative strength against Ethereum. When SOL outperforms ETH during market pullbacks, it indicates strong capital retention and higher probability of breakout success on SOL long setups.
Respect High Beta & Volatility: Solana tends to move faster and wider than BTC and ETH. Keep leverage modest (2x – 5x max) and widen your profit targets to reflect higher intraday volatility.
$SOL
#solana #sol板块 #SOL空投
☀️ Solana (SOL) Technical Analysis & Trading Framework
Solana is currently consolidating in the $116 – $120 range. After testing upper boundary resistance, short-term momentum has flattened, but SOL continues to hold a constructive daily higher-low structure. Traders are watching key range boundaries closely to capitalize on the next expansion phase.
📊 Key Technical Levels to Watch
ZonePrice RangeTechnical ContextOverhead Resistance$120 – $123Crucial resistance barrier; a daily close above this unlocks targets near $125–$130.Key Demand Floor$113 – $116Core short-term support and 4H EMA cluster.Macro InvalidationBelow $96Losing $95–$96 breaks the daily bullish trend structure.
💡 Execution Framework & Trade Setups
1. Breakout & Retest (Momentum Long)
Trigger: Wait for a 4-hour candle close strictly above $120 accompanied by rising On-Balance Volume (OBV).
Targets: $125 / $130.
Stop Loss: Below $117.50.
2. Support Liquidity Sweep (Range Long)
Trigger: Look for an intraday wick into $113 – $116 followed by a 1-hour bullish reversal candle or RSI bullish divergence.
Targets: $120 / $123.
Stop Loss: Below $111.50.
⚙️ Solana-Specific Trading Tips
Watch Ecosystem Volume & On-Chain DEX Flows: Solana price momentum often leads or coincides with spikes in Raydium/Orca DEX volume and meme token liquidity. Surging on-chain activity frequently signals institutional and retail buying before spot order books move.
Monitor SOL/ETH Performance: Track relative strength against Ethereum. When SOL outperforms ETH during market pullbacks, it indicates strong capital retention and higher probability of breakout success on SOL long setups.
Respect High Beta & Volatility: Solana tends to move faster and wider than BTC and ETH. Keep leverage modest (2x – 5x max) and widen your profit targets to reflect higher intraday volatility.
$SOL
#solana #sol板块 #SOL空投