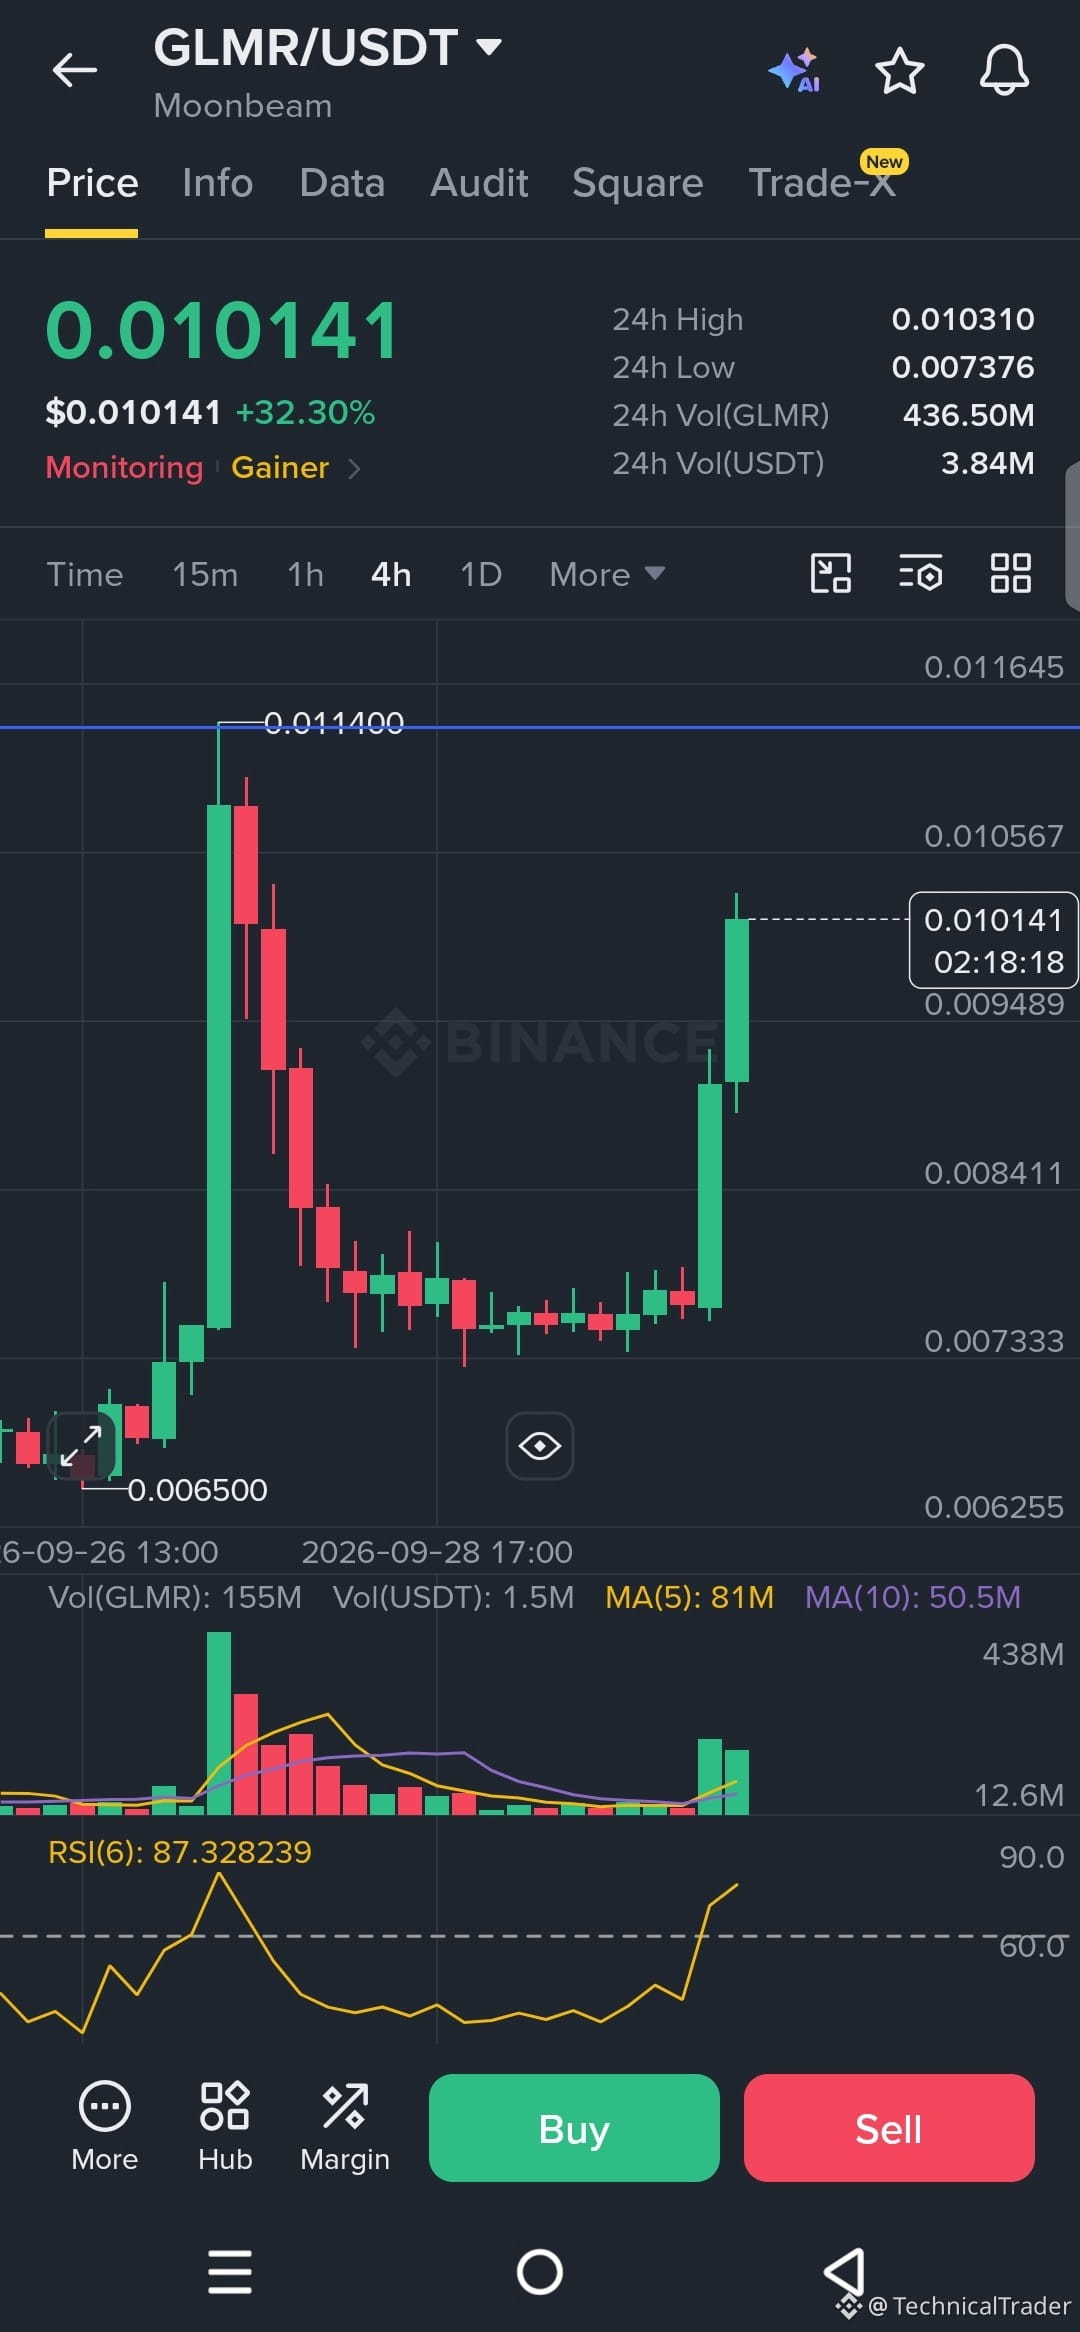
$GLMR is bouncing hard on the 4H chart, and price is sitting at 0.010141 after two strong green candles! 📈
Look at the earlier spike... it topped out at 0.011400 and then got sold off step by step.
After that, price spent a long time moving sideways around the 0.007333 area → building a small base.
Notice how it broke out of that range with a big green candle? Buyers stepped in fast. 🔥
VOLUME is picking up again on these last candles → but still lower than the first spike.
Now the interesting part... RSI is around 87, which is overbought again. ⚡️
The first RESISTANCE to watch is 0.010567 → above that, the 0.011400 HIGH is the big one.
If price keeps holding above 0.009489... another push higher could be possible. 👀
But if that area breaks ⇒ watch 0.008411 as the next SUPPORT, then the 0.007333 base.
THIS 0.009489 AREA IS IMPORTANT... losing it would weaken the bounce. 🎯
Follow for more chart analysis 😎
Look at the earlier spike... it topped out at 0.011400 and then got sold off step by step.
After that, price spent a long time moving sideways around the 0.007333 area → building a small base.
Notice how it broke out of that range with a big green candle? Buyers stepped in fast. 🔥
VOLUME is picking up again on these last candles → but still lower than the first spike.
Now the interesting part... RSI is around 87, which is overbought again. ⚡️
The first RESISTANCE to watch is 0.010567 → above that, the 0.011400 HIGH is the big one.
If price keeps holding above 0.009489... another push higher could be possible. 👀
But if that area breaks ⇒ watch 0.008411 as the next SUPPORT, then the 0.007333 base.
THIS 0.009489 AREA IS IMPORTANT... losing it would weaken the bounce. 🎯
Follow for more chart analysis 😎