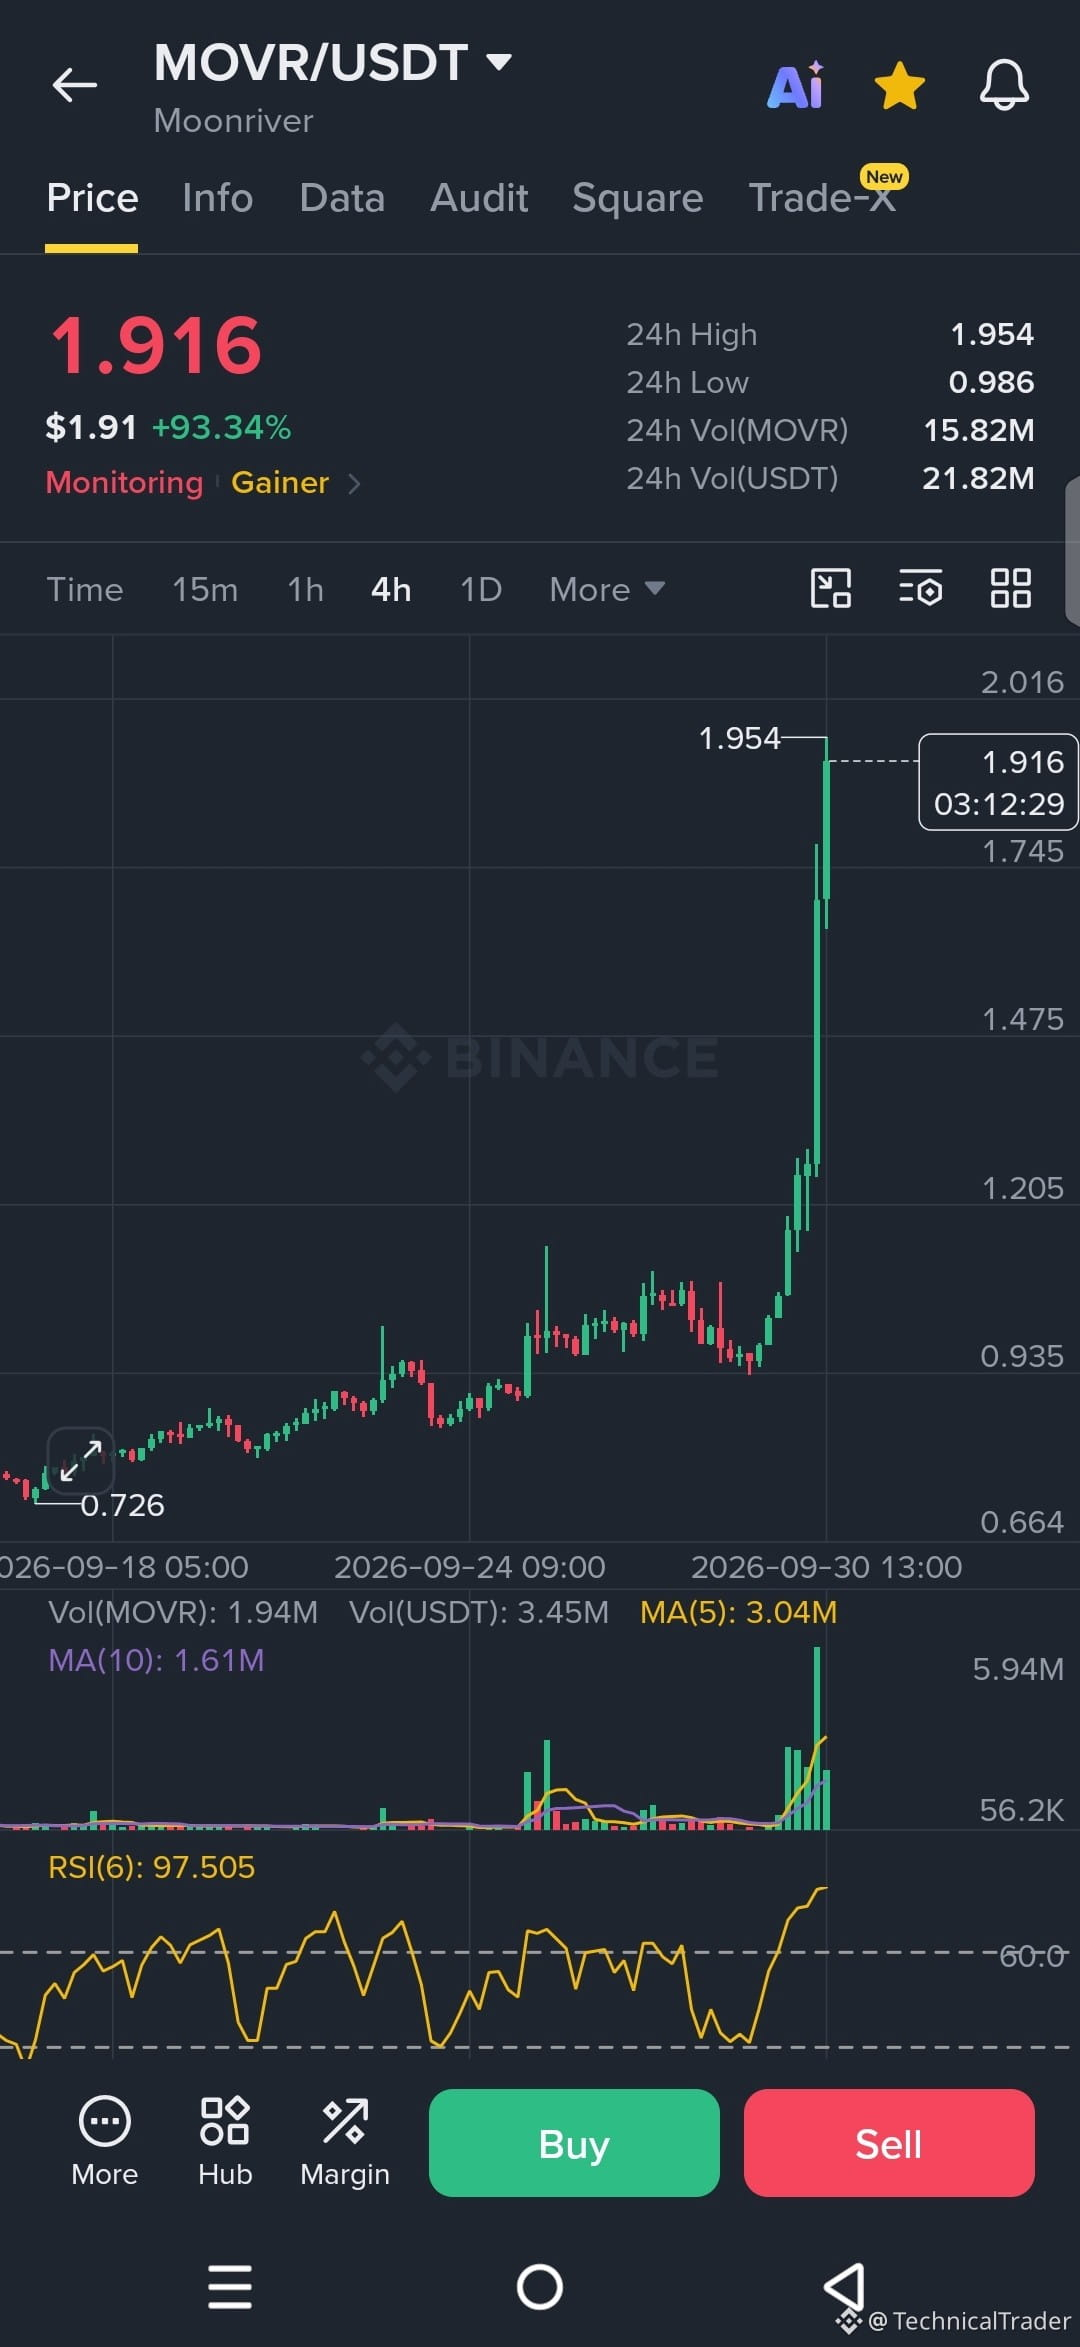
$MOVR just went vertical on the 4H chart, and price is sitting at 1.916 after a huge move! 🚀
Look at that massive green candle... it exploded from the 1.205 area straight up toward the 1.954 HIGH. 👀
Before that, price was moving sideways around 0.935 and building a base → then BREAKOUT with strong volume.
Notice the VOLUME spike on this move? Buyers came in aggressively. 🔥
Now the interesting part... RSI is around 97.5, which is extremely overbought. ⚡️
Price is right under the 1.954 RESISTANCE → a clean break above it could bring continuation.
But if price gets REJECTED here ⇒ watch 1.745 as the first SUPPORT below.
Lose 1.745 ⇒ next visible levels are 1.475, then 1.205 where the BREAKOUT started. 📉
PRICE NEEDS TO HOLD ABOVE 1.745 TO KEEP THIS MOVE ALIVE... a close below it would weaken the idea. 🎯
Guys follow for more chart analysis 😎
Look at that massive green candle... it exploded from the 1.205 area straight up toward the 1.954 HIGH. 👀
Before that, price was moving sideways around 0.935 and building a base → then BREAKOUT with strong volume.
Notice the VOLUME spike on this move? Buyers came in aggressively. 🔥
Now the interesting part... RSI is around 97.5, which is extremely overbought. ⚡️
Price is right under the 1.954 RESISTANCE → a clean break above it could bring continuation.
But if price gets REJECTED here ⇒ watch 1.745 as the first SUPPORT below.
Lose 1.745 ⇒ next visible levels are 1.475, then 1.205 where the BREAKOUT started. 📉
PRICE NEEDS TO HOLD ABOVE 1.745 TO KEEP THIS MOVE ALIVE... a close below it would weaken the idea. 🎯
Guys follow for more chart analysis 😎