$SKHYNIX Recovers From the Flush But Sellers Aren't Convinced
Pair: $SKHYNIX /USDT
Direction: SHORT
Leverage: 5x
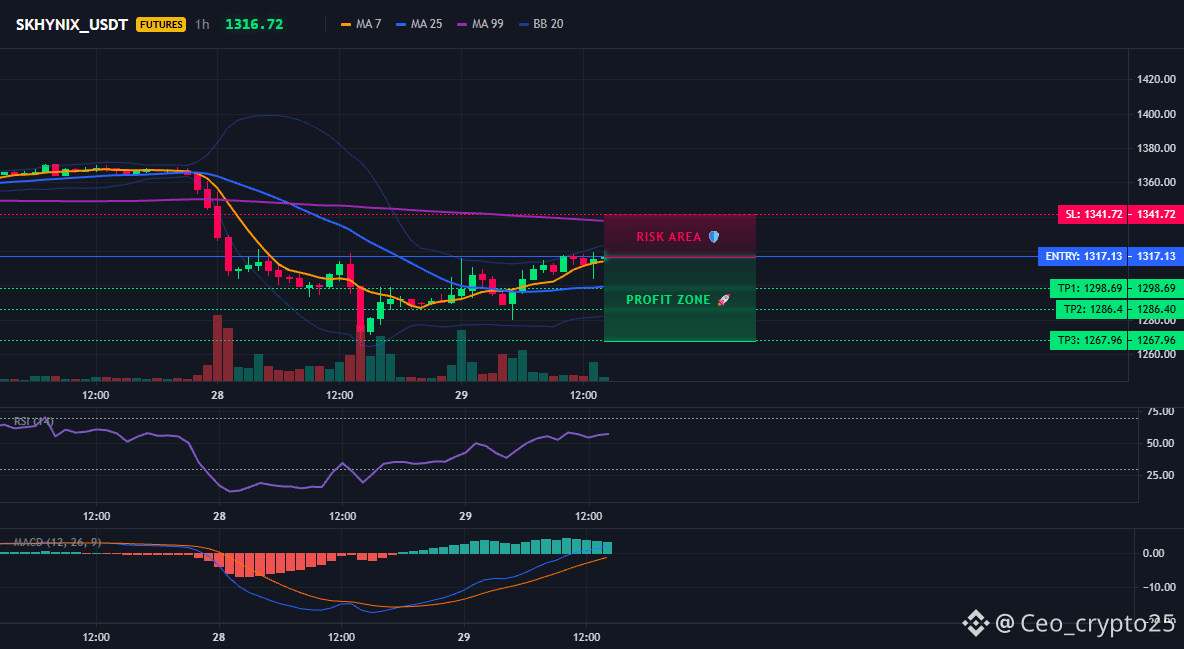
Entry Zone: 1314.50 – 1319.50
Take Profit:
- TP1: 1298.69 +6%
- TP2: 1286.40 +12%
- TP3: 1267.96 +19%
Stop Loss: 1341.72
Chart Structure:
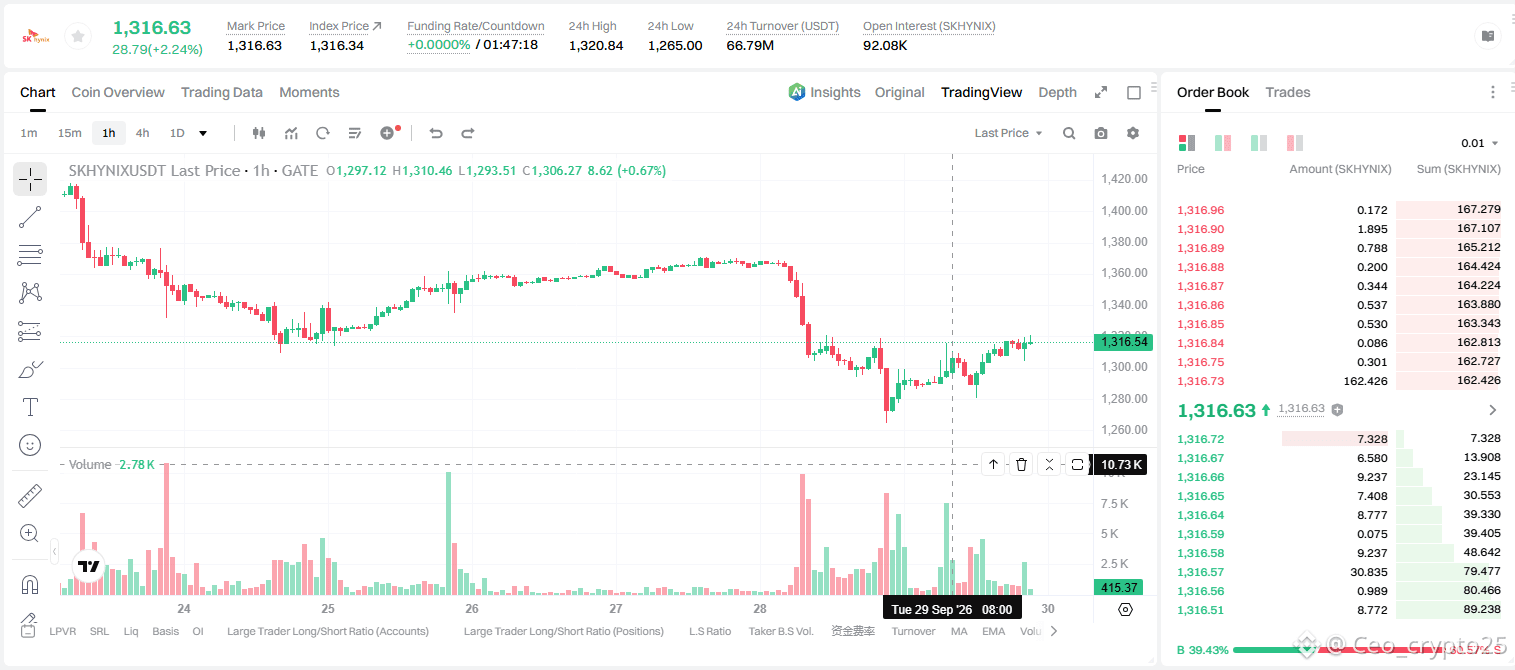
- SKHYNIX dropped sharply from a ~1370 high, breaking below MA7, MA25, and eventually the MA99, before basing and recovering back to test the moving-average cluster near current price (~1316–1317)
- Current price sits right at the entry zone, testing the underside of the broken structure a level where sellers have previously stepped in during this decline
- ⚠️ Mixed signal: RSI 14 has recovered from oversold (~20s) into the low-50s, and MACD just crossed positive with a rising histogram both indicators are actually turning bullish, working against this short
- Given the improving momentum, this is a contrarian fade rather than a high-conviction trend continuation the recovery could easily extend further before any rejection
- Stop is placed above the recent local high, which marks resistance after the breakdown
- Confirmation to watch: a clear rejection candle at 1317–1330 supports the short; continued MACD strength or a close above 1342 would invalidate it and favor the bulls instead
$SKHYNIX
Pair: $SKHYNIX /USDT
Direction: SHORT
Leverage: 5x
Entry Zone: 1314.50 – 1319.50
Take Profit:
- TP1: 1298.69 +6%
- TP2: 1286.40 +12%
- TP3: 1267.96 +19%
Stop Loss: 1341.72
Chart Structure:
- SKHYNIX dropped sharply from a ~1370 high, breaking below MA7, MA25, and eventually the MA99, before basing and recovering back to test the moving-average cluster near current price (~1316–1317)
- Current price sits right at the entry zone, testing the underside of the broken structure a level where sellers have previously stepped in during this decline
- ⚠️ Mixed signal: RSI 14 has recovered from oversold (~20s) into the low-50s, and MACD just crossed positive with a rising histogram both indicators are actually turning bullish, working against this short
- Given the improving momentum, this is a contrarian fade rather than a high-conviction trend continuation the recovery could easily extend further before any rejection
- Stop is placed above the recent local high, which marks resistance after the breakdown
- Confirmation to watch: a clear rejection candle at 1317–1330 supports the short; continued MACD strength or a close above 1342 would invalidate it and favor the bulls instead
$SKHYNIX