$BTC /USDT) — Next Month Market Outlook
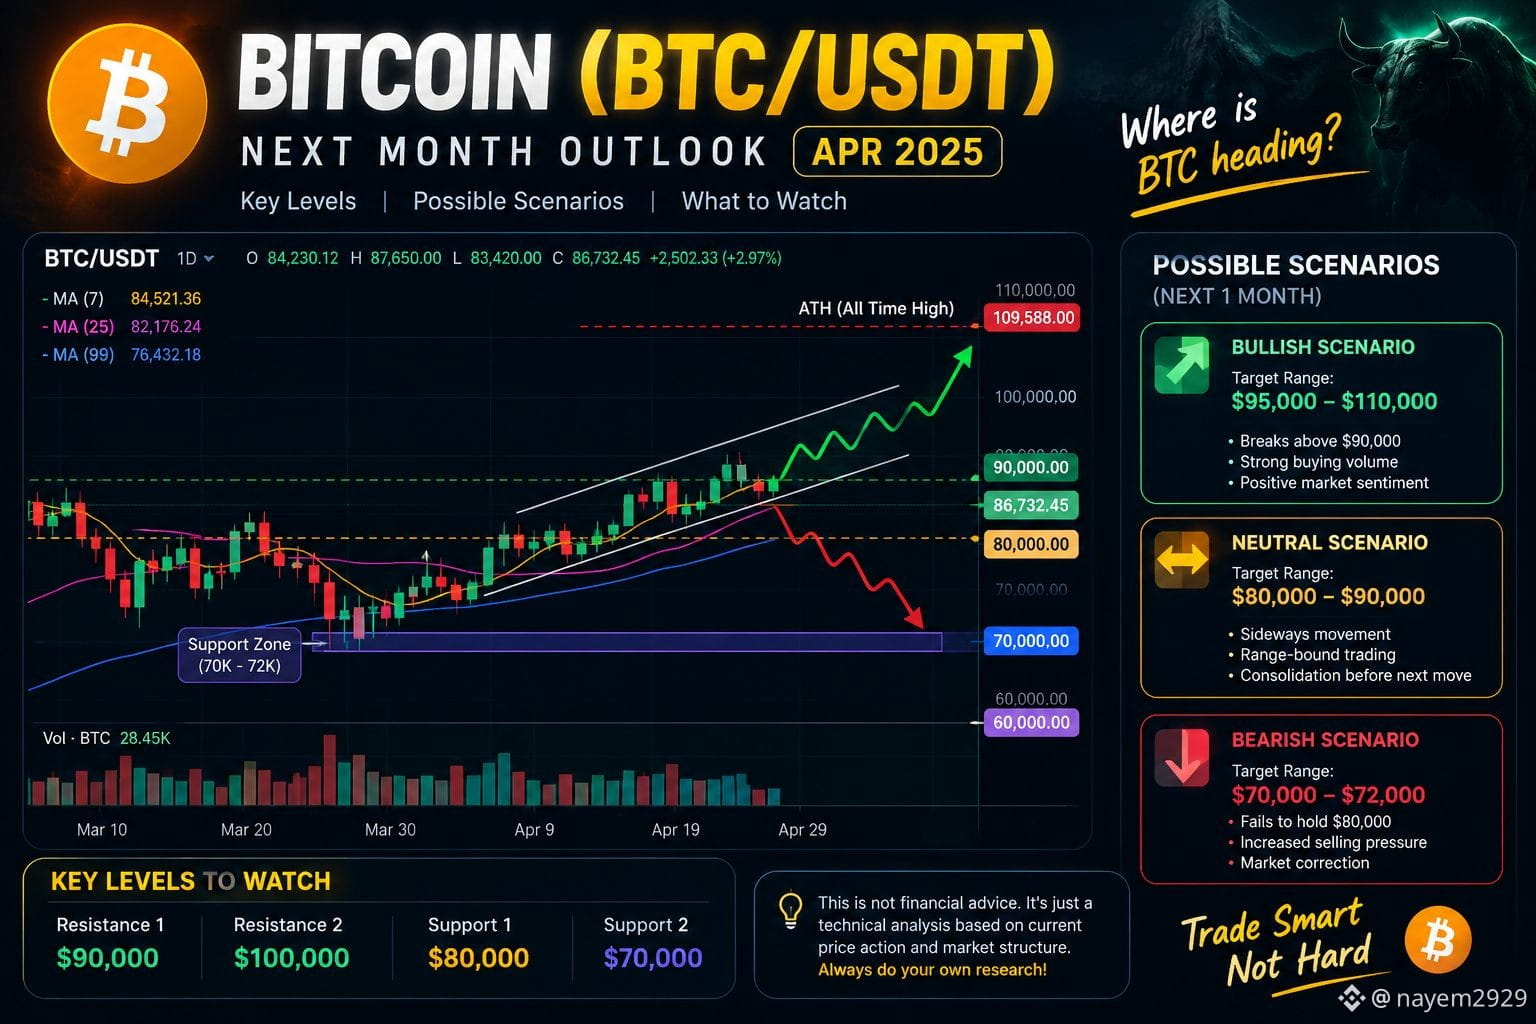
Bitcoin continues to remain one of the most closely watched assets in the crypto market. Based on the technical structure shown in the chart, the coming weeks could be an important period for BTC as price approaches several key support and resistance zones.
The chart highlights $80,000 and $90,000 as important areas to watch, while the $70,000–$72,000 zone appears as a major downside support area.
🟢 Bullish Scenario
If BTC manages to break above the $90,000 resistance zone with strong buying volume and maintains momentum, the next potential areas of interest could be around $95,000–$100,000, with the possibility of testing higher levels if bullish momentum continues.
🟡 Neutral Scenario
If Bitcoin fails to establish a clear breakout, the market could remain range-bound between approximately $80,000 and $90,000. During this phase, consolidation and increased volatility could occur before the next major move.
🔴 Bearish Scenario
On the other hand, if BTC loses the $80,000 support area and selling pressure increases, the market could potentially move toward the $70,000–$72,000 support zone.
👀 What Traders Should Watch
• BTC reaction around $80K
• Breakout or rejection near $90K
• Trading volume during major moves
• Moving-average structure
• Overall market sentiment
• Bitcoin's ability to hold important support levels
The key point is that these are possible scenarios, not guaranteed price targets. Crypto markets can change quickly, and unexpected news or liquidity movements can invalidate a technical setup.
⚠️ Not financial advice. This post is for educational and informational purposes only. Always do your own research and manage your risk before making any trading decision.
What do you think — will BTC break higher, consolidate, or revisit lower support? 👇
#Bitcoin #BTC #BTCUSDT #Crypto #CryptoTrading #BitcoinAnalysis #TechnicalAnalysis #Binance #crypto #TradingCommunity #BitcoinPriceDrop #Altcoin #BTCanalysis
Bitcoin continues to remain one of the most closely watched assets in the crypto market. Based on the technical structure shown in the chart, the coming weeks could be an important period for BTC as price approaches several key support and resistance zones.
The chart highlights $80,000 and $90,000 as important areas to watch, while the $70,000–$72,000 zone appears as a major downside support area.
🟢 Bullish Scenario
If BTC manages to break above the $90,000 resistance zone with strong buying volume and maintains momentum, the next potential areas of interest could be around $95,000–$100,000, with the possibility of testing higher levels if bullish momentum continues.
🟡 Neutral Scenario
If Bitcoin fails to establish a clear breakout, the market could remain range-bound between approximately $80,000 and $90,000. During this phase, consolidation and increased volatility could occur before the next major move.
🔴 Bearish Scenario
On the other hand, if BTC loses the $80,000 support area and selling pressure increases, the market could potentially move toward the $70,000–$72,000 support zone.
👀 What Traders Should Watch
• BTC reaction around $80K
• Breakout or rejection near $90K
• Trading volume during major moves
• Moving-average structure
• Overall market sentiment
• Bitcoin's ability to hold important support levels
The key point is that these are possible scenarios, not guaranteed price targets. Crypto markets can change quickly, and unexpected news or liquidity movements can invalidate a technical setup.
⚠️ Not financial advice. This post is for educational and informational purposes only. Always do your own research and manage your risk before making any trading decision.
What do you think — will BTC break higher, consolidate, or revisit lower support? 👇
#Bitcoin #BTC #BTCUSDT #Crypto #CryptoTrading #BitcoinAnalysis #TechnicalAnalysis #Binance #crypto #TradingCommunity #BitcoinPriceDrop #Altcoin #BTCanalysis