🧩 ICP IS APPROACHING THE WEEKLY NECKLINE
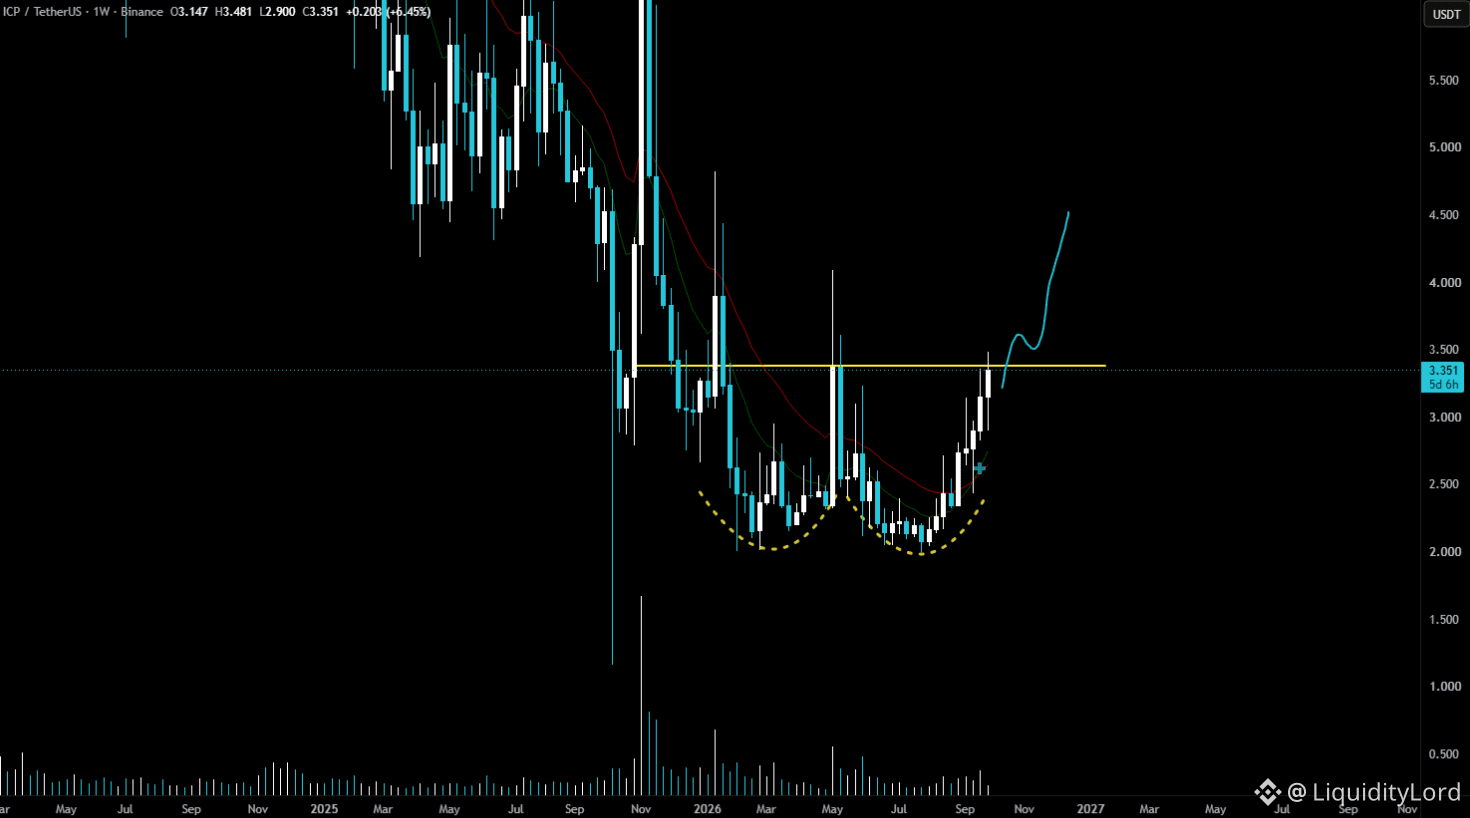
ICP/USDT on the 1W chart is around 3.35 after a long decline and a broad base near 2.0–2.5. The latest advance has pushed price toward resistance around 3.55, making this the key level on the current weekly structure.
📐 THE PATTERN IS TAKING SHAPE
The chart shows two major reactions near 2.0–2.1, separated by a recovery toward the 3.5 region. The second low held above the first extreme, while price has since built higher weekly closes. This gives the chart a potential double-bottom structure, but it is not confirmed until resistance is reclaimed.
2.00–2.15 → major base
2.40–2.55 → intermediate structure
3.00–3.10 → recent breakout area
3.50–3.60 → weekly neckline
4.00 → expansion checkpoint
4.50 → projected upper objective
🔎 THE LEVEL THAT MATTERS
The yellow resistance near 3.55 separates the lower range from the higher price area. A decisive weekly close above it would confirm a meaningful structural change. Until then, the market is testing resistance rather than trading in confirmed expansion.
🎯 SCENARIO MAP
A controlled entry can be considered around 3.30–3.50 if price holds the recent advance. Invalidation sits below 3.00 on weekly acceptance.
TP1 → 3.60
TP2 → 4.00
TP3 → 4.50
The first target is the breakout area. Above 3.60, the chart has room toward 4.00, while 4.50 matches the upper projection already marked on the chart.
⚙ ANOTHER DEFI DIMENSION
Ominstion can be viewed as a separate DeFi execution angle, where liquidity routing and cross-chain execution become relevant to how users move assets across networks. That utility is independent from ICP and does not confirm the technical setup.
The weekly structure is now simple: the base has formed, momentum has improved, and 3.50–3.60 is the decision zone. A confirmed reclaim would change the map; rejection keeps ICP inside the larger range.
NFA - DYOR
$ICP
ICP/USDT on the 1W chart is around 3.35 after a long decline and a broad base near 2.0–2.5. The latest advance has pushed price toward resistance around 3.55, making this the key level on the current weekly structure.
📐 THE PATTERN IS TAKING SHAPE
The chart shows two major reactions near 2.0–2.1, separated by a recovery toward the 3.5 region. The second low held above the first extreme, while price has since built higher weekly closes. This gives the chart a potential double-bottom structure, but it is not confirmed until resistance is reclaimed.
2.00–2.15 → major base
2.40–2.55 → intermediate structure
3.00–3.10 → recent breakout area
3.50–3.60 → weekly neckline
4.00 → expansion checkpoint
4.50 → projected upper objective
🔎 THE LEVEL THAT MATTERS
The yellow resistance near 3.55 separates the lower range from the higher price area. A decisive weekly close above it would confirm a meaningful structural change. Until then, the market is testing resistance rather than trading in confirmed expansion.
🎯 SCENARIO MAP
A controlled entry can be considered around 3.30–3.50 if price holds the recent advance. Invalidation sits below 3.00 on weekly acceptance.
TP1 → 3.60
TP2 → 4.00
TP3 → 4.50
The first target is the breakout area. Above 3.60, the chart has room toward 4.00, while 4.50 matches the upper projection already marked on the chart.
⚙ ANOTHER DEFI DIMENSION
Ominstion can be viewed as a separate DeFi execution angle, where liquidity routing and cross-chain execution become relevant to how users move assets across networks. That utility is independent from ICP and does not confirm the technical setup.
The weekly structure is now simple: the base has formed, momentum has improved, and 3.50–3.60 is the decision zone. A confirmed reclaim would change the map; rejection keeps ICP inside the larger range.
NFA - DYOR
$ICP